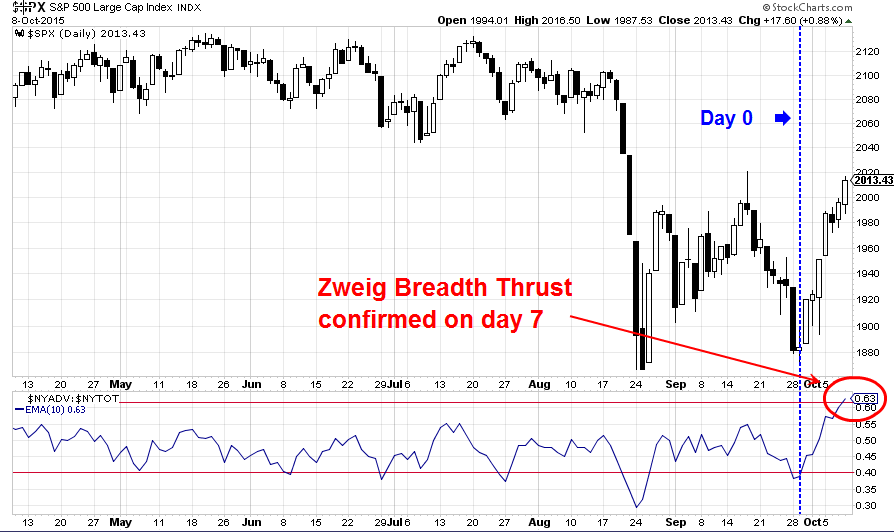
In my weekend post last week, I highlighted a possible setup for a Zweig Breadth Thrust buy signal (see Sell in May, ______ in October). The Zweig Breadth Thrust is an extremely rare buy signal that generally signals the start of a new bull market (see A possible, but rare bull market signal).
Steven Achelis at Metastock explained the indicator this way (emphasis added):
A "Breadth Thrust" occurs when, during a 10-day period, the Breadth Thrust indicator rises from below 40% to above 61.5%. A "Thrust" indicates that the stock market has rapidly changed from an oversold condition to one of strength, but has not yet become overbought.According to Dr. Zweig, there have only been fourteen Breadth Thrusts since 1945. The average gain following these fourteen Thrusts was 24.6% in an average time-frame of eleven months. Dr. Zweig also points out that most bull markets begin with a Breadth Thrust.
As of the close yesterday (Thursday October 8, 2015), we have another ZBT buy signal.
Learning from 2009
The last ZBT that I can find occurred at the market bottom in March 2009.
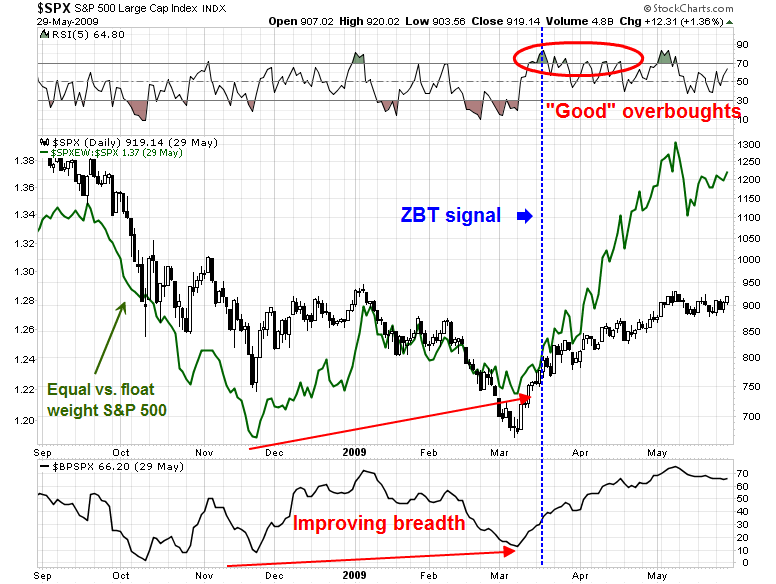
While history doesn't always repeat itself exactly, I can see a number of similarities that may give us a road map to how the market is likely to behave in the next few months. Here is what happened in 2009:
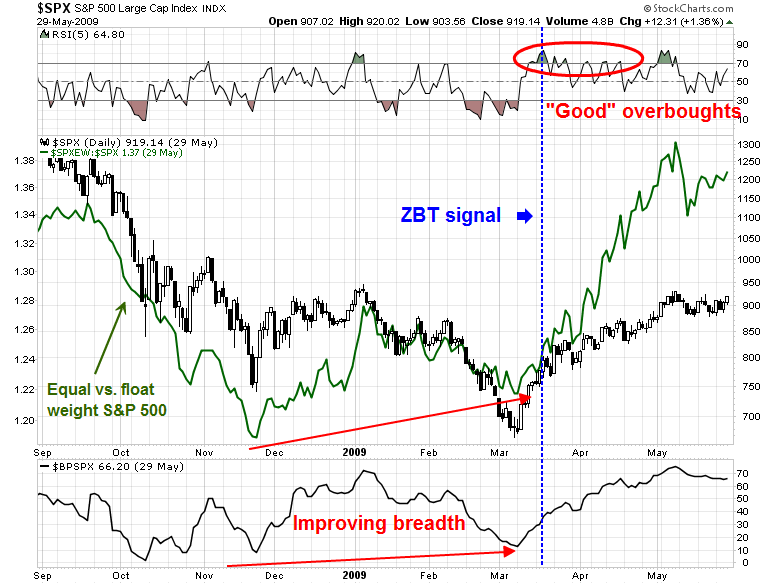
We can observe that breadth was improving when the market bottomed in March 2009. A ZBT is a powerful exhibition of buying momentum and RSI(5) has not unexpectedly flashed an overbought reading. Right after the signal, the market weakened and pulled back for two days and continued upwards, showing a series of "good" overbought readings as it advanced.
Today, we can observe similar conditions. Breadth measures have improved since the "bottom" last week, though the low last week did not exactly test the August panic lows.
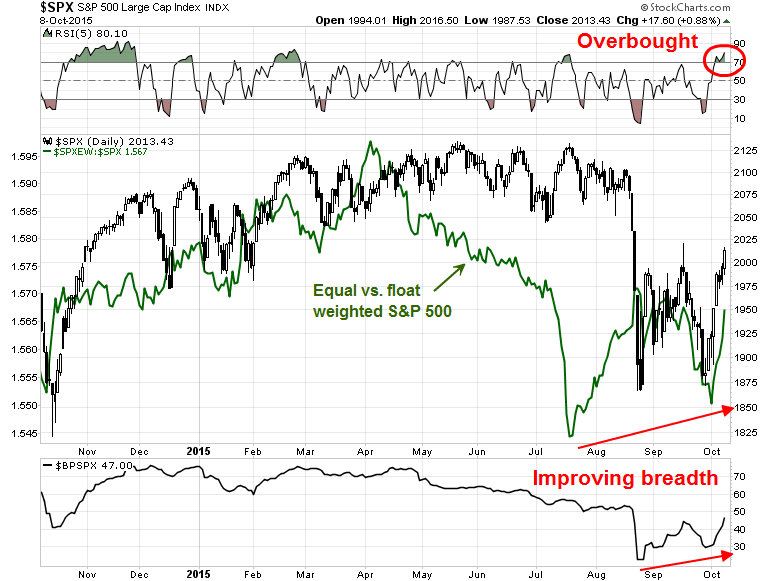
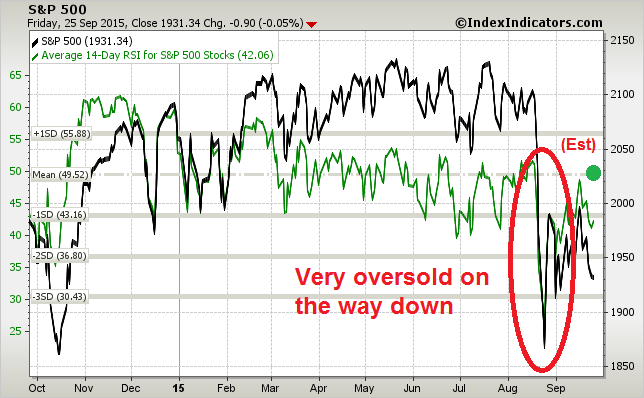
The market has also become overbought on RSI(5). These series of charts from IndexIndicators (with my own estimate shown as a dot) also shows how overbought the market is on a 1-3 day time horizon:
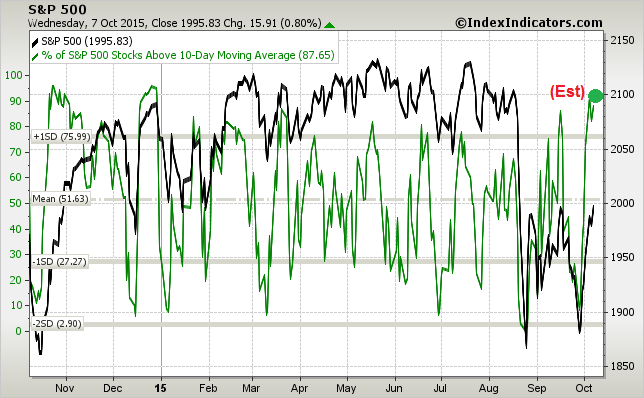
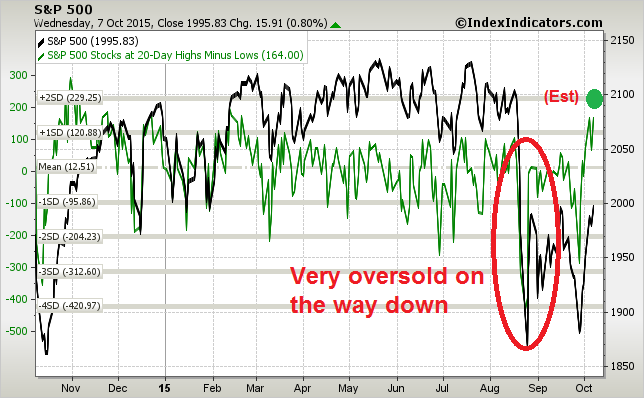
...and longer term indicators with a 1-2 week time horizon, based on a net 20 day highs-lows measure. I would remind you, however, that overbought conditions can stay overbought (see the reference to "good" overbought readings above) and the market got off the charts oversold in the way down in August.
We see similar readings on an intermediate term 1-2 week basis using the average 14-day RSI indicator as well:
A powerful "buy" signal
If history is any guide, the Zweig Breadth Thrust is signaling that stocks are about to embark on another upleg. While the market is very overbought and I have no idea of what might happen in the next few days given the volatility seen during Earnings Season, these conditions are highly suggestive that downside risk is extremely limited and stocks will be significantly higher by year-end.
Disclosure: Cam Hui is a portfolio manager at Qwest Investment Fund Management Ltd. (""Qwest""). This article is prepared by Mr. Hui as an outside business activity. As such, Qwest does not review or approve materials presented herein. The opinions and any recommendations expressed in this blog are those of the author and do not reflect the opinions or recommendations of Qwest.
None of the information or opinions expressed in this blog constitutes a solicitation for the purchase or sale of any security or other instrument. Nothing in this article constitutes investment advice and any recommendations that may be contained herein have not been based upon a consideration of the investment objectives, financial situation or particular needs of any specific recipient. Any purchase or sale activity in any securities or other instrument should be based upon your own analysis and conclusions. Past performance is not indicative of future results. Either Qwest or Mr. Hui may hold or control long or short positions in the securities or instruments mentioned.

