Get 40% Off
💰 Buffett reveals a $6.7B stake in Chubb. Copy the full portfolio for FREE with InvestingPro’s Stock Ideas toolCopy Portfolio

Better From Bulls – Shorts Failing To Apply Pressure

Published 05/02/2018, 12:30 AM
Updated 07/09/2023, 06:31 AM
NDX
-
US500
-
DJI
-
US2000
-
IXIC
-
DJUSSC
-

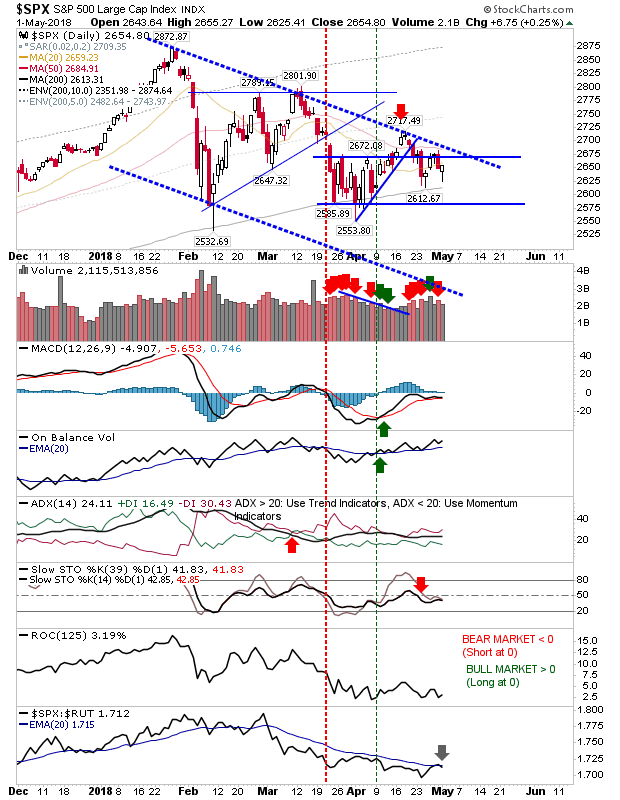
Since the breakdown in wedge support it had looked easier for bears to push indices down to 200-day MAs or lower channel support, but action over the last week with two bullish hammers suggests longs may have a launch pad to work with.

The S&P is offering a nice setup with the 'bullish hammers' just above the 200-day MAs. The only disappointment was the 'sell' signal in relative performance in the Russell 2000.
SPX Daily Chart

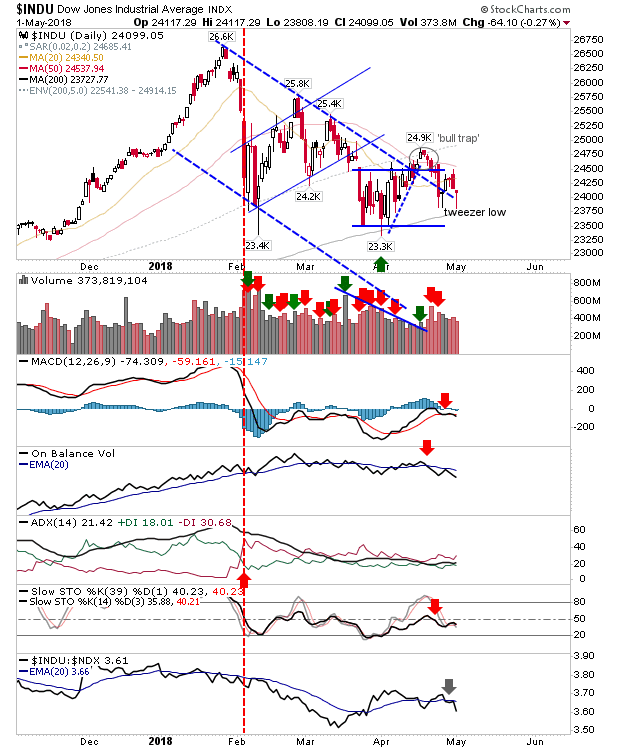
The Dow Jones posted a doji which tagged the tweezer low – and nearly the 200-day MA – while maintaining a close price above the downward channel. This continues to offer itself as a good bullish setup despite weak technicals and an even sharper drop in relative performance (vs the NASDAQ 100).
INDU Daily Chart

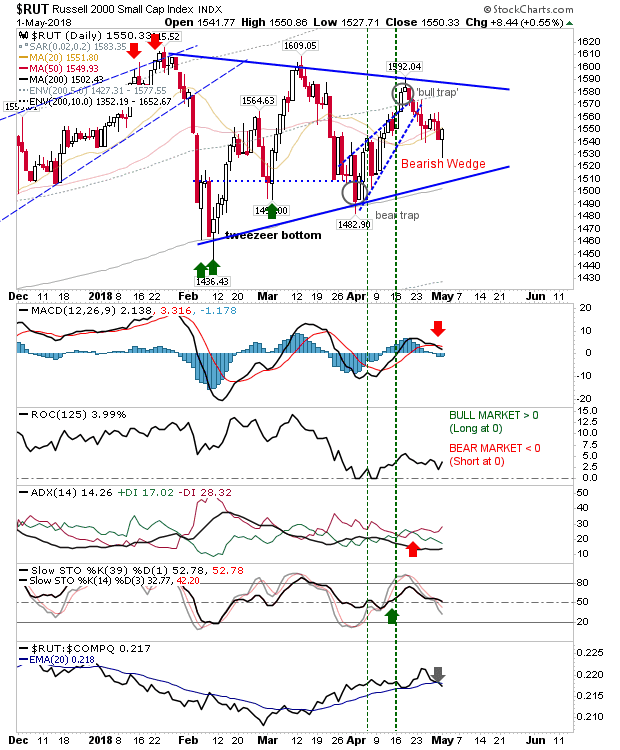
The Russell 2000 created a solid 'bullish hammer' but it also came with weak technicals and a downturn in relative performance. Price action remains key and if the Russell 2000 can post a gain on Wednesday it will set up an opportunity to challenge triangle resistance.
RUT Daily Chart

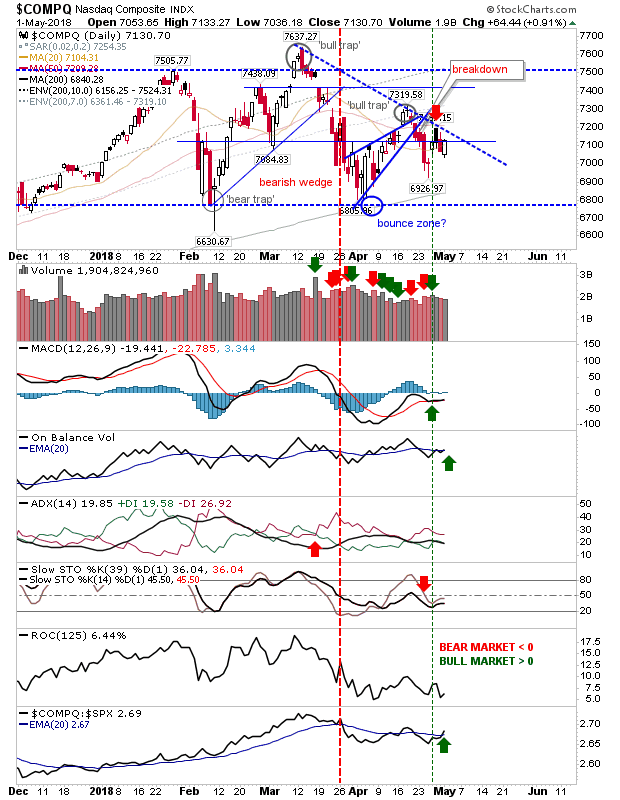
The NASDAQ remains closest to declining resistance and unlike other indices it enjoyed an uptick in relative performance. The bearish 'black candlestick' has still to be challenged (and negated) but a break of declining resistance should be enough to do so.
COMPA Daily Chart

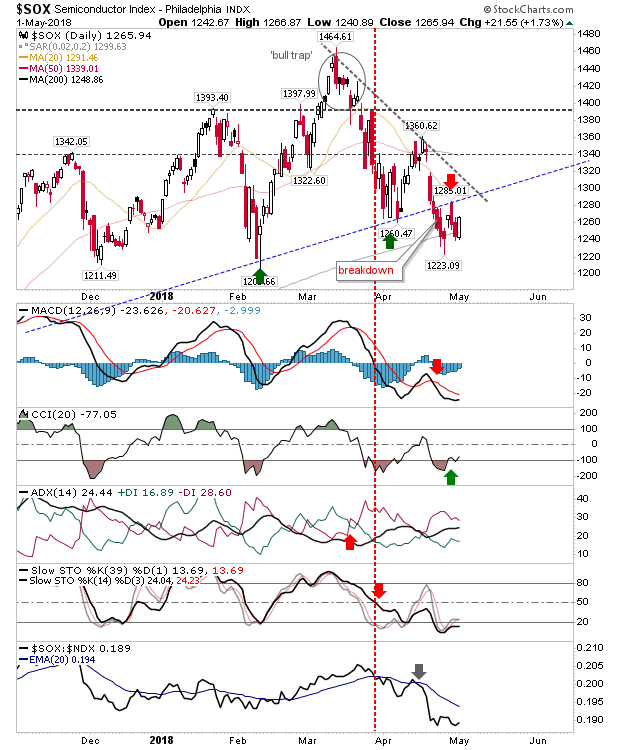
The weakest index – Semiconductors – found support at the 200-day MA although it remained below rising trendline support. It still has work to do to recover support but Tuesday offered a sound basis for this.
3rd party Ad. Not an offer or recommendation by Investing.com. See disclosure here or remove ads .

SOX Daily Chart

The prior short setups, while not negated, don't look like they are going to deliver. Longs have the edge in the short term (

Latest comments

nonsensical trend lines drawn here
... for SPY
2 bottoms on the 2 hour chart. One bottom in each month April and May,  and a higher bottom today. Not bad !!
Risk Disclosure: Trading in financial instruments and/or cryptocurrencies involves high risks including the risk of losing some, or all, of your investment amount, and may not be suitable for all investors. Prices of cryptocurrencies are extremely volatile and may be affected by external factors such as financial, regulatory or political events. Trading on margin increases the financial risks.
Before deciding to trade in financial instrument or cryptocurrencies you should be fully informed of the risks and costs associated with trading the financial markets, carefully consider your investment objectives, level of experience, and risk appetite, and seek professional advice where needed.
Fusion Media would like to remind you that the data contained in this website is not necessarily real-time nor accurate. The data and prices on the website are not necessarily provided by any market or exchange, but may be provided by market makers, and so prices may not be accurate and may differ from the actual price at any given market, meaning prices are indicative and not appropriate for trading purposes. Fusion Media and any provider of the data contained in this website will not accept liability for any loss or damage as a result of your trading, or your reliance on the information contained within this website.
It is prohibited to use, store, reproduce, display, modify, transmit or distribute the data contained in this website without the explicit prior written permission of Fusion Media and/or the data provider. All intellectual property rights are reserved by the providers and/or the exchange providing the data contained in this website.
Fusion Media may be compensated by the advertisers that appear on the website, based on your interaction with the advertisements or advertisers.
© 2007-2024 - Fusion Media Limited. All Rights Reserved.