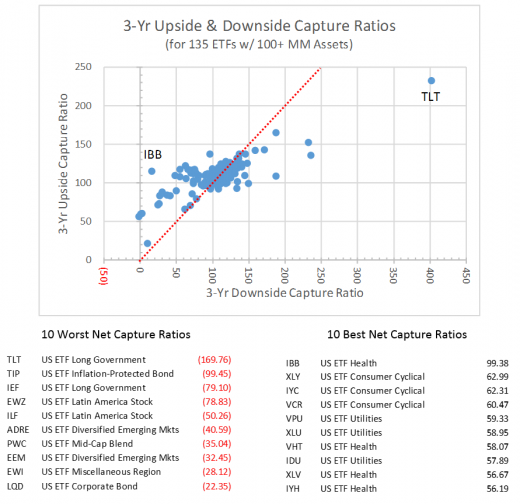
Attractive funds have higher upside capture ratios than downside capture ratios, which are measures of participation in monthly up and down periods of the fund versus its primary benchmark index.
Upside and downside capture ratios are a complement to other risk/reward measures such as the Sharpe Ratio and the Sortino Ratio. All such measures are retrospective and are not alone sufficient for the necessary forward view of an prospective investment or existing holding, but they should be considered in the total data mix.
Here is a look at the best and worst ETFs for net capture ratio (upside ratio minus downside ratio) for those ETFs that have at least $100 million in assets and 10 years of history. The 10 year history filter was to attempt to eliminate possible effects of new funds outperforming older funds due to smaller size. As funds increase in size they are forced to become more like their benchmark in composition, moving toward a zero net capture ratio.

Best: iShares Nasdaq Biotech (NASDAQ:IBB), SPDR Consumer Discretionary Select Sector (ARCA:XLY), iShares US Consumer Services (NYSE:IYC),Vanguard Consumer Discretionary (NYSE:VCR), Vanguard Utilities (NYSE:VPU), SPDR Select Sector - Utilities (NYSE:XLU), Vanguard Health Care (NYSE:VHT), iShares US Utilities (NYSE:IDU), SPDR - Health Care (ARCA:XLV), iShares US Healthcare (NYSE:IYH)
Worst: iShares Barclays 20+ Year Treasury (ARCA:TLT), iShares Barclays TIPS Bond Fund (ARCA:TIP), iShares Barclays 7-10 Year Treasury Bond (ARCA:IEF), iShares Brazil Index (ARCA:EWZ), iShares Latin America 40 Index (NYSE:ILF), PowerShares BLDRS EM 50 ADR (NASDAQ:ADRE), PowerShares XTF: Dynamic Market (NYSE:PWC), iShares MSCI Emerging Markets (ARCA:EEM), iShares MSCI Italy Capped Fund (ARCA:EWI), iShares Inv G Bond (ARCA:LQD)
The best fund was IBB (biotech) and the worst fund was TLT (long-term Treasuries).
The top 10 funds consisted of healthcare, consumer cyclicals and utilities (all participating more in benchmark up moves and less in benchmark down moves). The bottom 10 consisted mostly of bond funds and emerging market funds.
Upside and downside capture ratios are calculated by comparing the fund performance to its primary benchmark index. Each month for the primary index is measured as either up or down, then the price movement of the fund is compared to the price movement of the benchmark. For example if the primary benchmark rises by 1% in a month and the fund rises by 1.1%, then the upside capture ratio is 110%; and if the primary benchmark declines by 1% in a month, but the fund declines by 0.9%, then the downside capture ratio is 90%. In that example, the net capture ratio (calculated by us, not by Morningstar, would be positive 20% [ 110% less 90%].
The primary benchmarks used by Morningstar in calculating capture ratios are:
- S&P 500 index for U.S. stock funds,
- Dow Jones Moderate Portfolio Index for balanced funds,
- iShares MSCI EAFE (ARCA:EFA) index for International Stock funds,
- SPDR Barclays Aggregate Bond (NYSE:LAG) index for taxable-bond funds,
- Barclays Municipal Bond index for municipal bonds
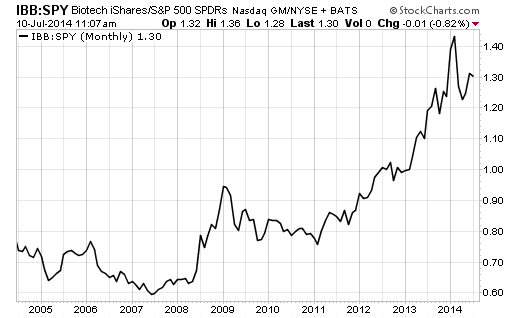
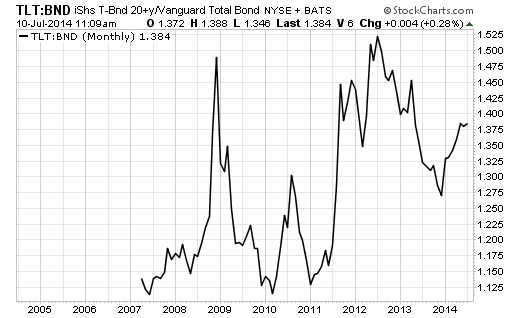
To visualize the capture ratios, here are monthly charts for IBB and TLT, in each case their price divided by the price of an ETF representing their primary benchmark from the list above:


Here are links for each of the best and worst ETFs to 3-yr weekly charts at StockCharts.com similar the two above (the free site only goes out 3 years and does not provide monthly intervals):
Disclosure: We do not currently own any of the listed ETFs.
