Bed Bath & Beyond Inc (NASDAQ:BBBY)
Bed Bath & Beyond Earnings and Technicals

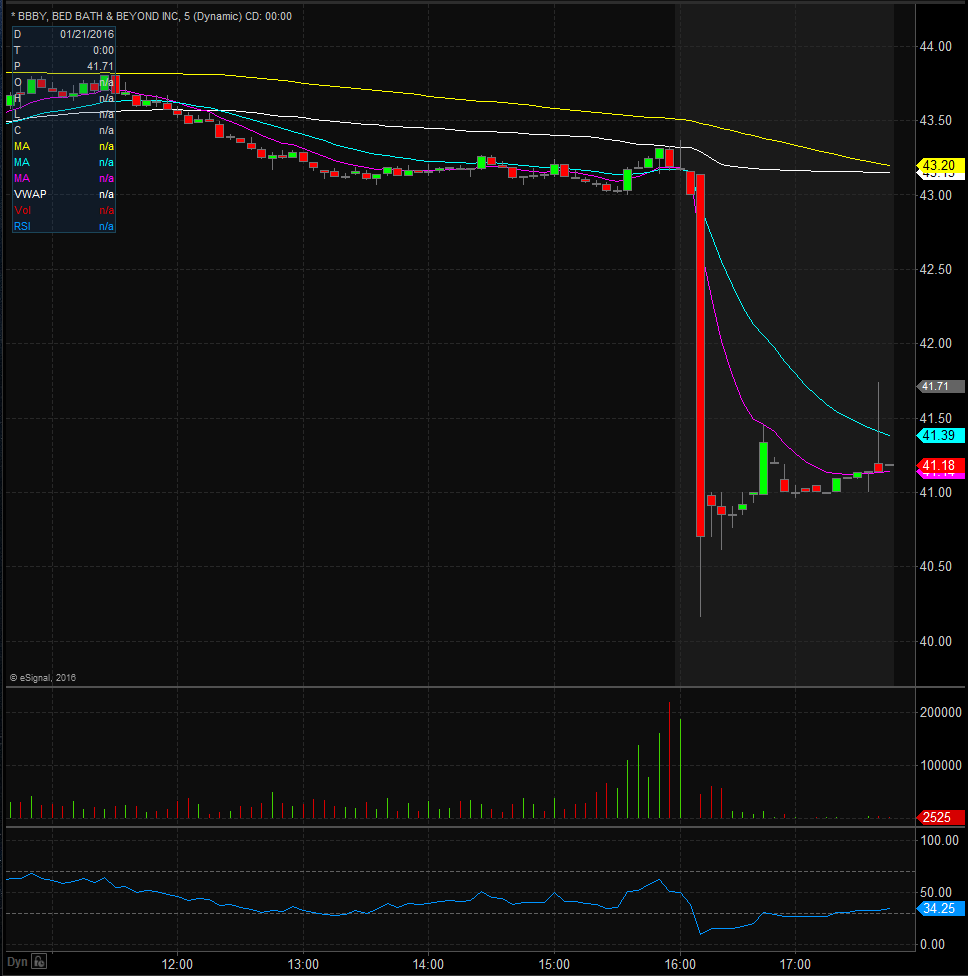
On Wednesday after the close, Bed Bath & Beyond (BBBY) announced first quarter earnings that missed analyst expectations and sent shares tumbling in the post market session. The company announced first quarter earnings of 80 cents per share on $2.74 billion in net sales, while analysts were looking for 86 cents per share on $2.77 billion in revenues.
BBBY also purchased online retailer One Kings Lane for an undisclosed amount recently in an all cash deal. Currently analysts have an average price target of $49.44.
Looking at the chart you will see that shares are under heavy selling pressure in the post-market session, as shares have hit current lows of $40.16 after closing the day at $43.18, equaling a 7% drop in value. Shares are also well below their 200-day moving average, currently sitting at $50.42, and they are looking to open below a key pivot level at $42.
Shares haven’t traded this low since late 2010, but we should see some support come in at $40 and $36, while resistance will be met at $41.25, $42 and $43.
Looking at the daily chart you will see that shares are down on the year and have had a hard time gaining any momentum, as they haven’t even been able to breach the 200-day moving average once this year.
Shares should be more volatile than normal on Thursday follow their earnings release, as there will be plenty of traders looking to take advantage of this big move.
BBBY Profile
Bed Bath & Beyond Inc., together with its subsidiaries, operates a chain of retail stores. It sells a range of domestics merchandise, including bed linens and related items, bath items, and kitchen textiles; and home furnishings, such as kitchen and tabletop items, fine tabletop, basic housewares, general home furnishings, consumables, and juvenile products. It also provides various textile products, amenities, and other goods to institutional customers in the hospitality, cruise line, healthcare, and other industries.
The company operates stores under the Bed Bath & Beyond (BBB); Christmas Tree Shops; Christmas Tree Shops andThat! or andThat! (CTS); Harmon or Harmon Face Values (Harmon); buybuy BABY (Baby); and World Market, Cost Plus World Market, and Cost Plus (Cost Plus World Market) names. As of February 27, 2016, the company had a total of 1,530 stores, including 1,020 BBB stores; 276 stores under the names of Cost Plus World Market; 105 Baby stores; 78 stores under the CTS names; and 51 stores under the Harmon names in 50 states, the District of Columbia, Puerto Rico, and Canada, as well as through bedbathandbeyond.com, bedbathandbeyond.ca, christmastreeshops.com, andthat.com, harmondiscount.com, facevalues.com, buybuybaby.com, buybuybaby.ca, worldmarket.com, and ofakind.com Websites. Bed Bath & Beyond Inc. was founded in 1971 and is based in Union, New Jersey.
