
- Another Volatile Week With Little Progress
- Approaching A “Bond Buying” Opportunity
- Interesting Tidbits
- Sector & Market Analysis
- 401k Plan Manager
- Tighten up stop-loss levels to current support levels for each position.
- Hedge portfolios against major market declines.
- Take profits in positions that have been big winners
- Sell laggards and losers
- Raise cash and rebalance portfolios to target weightings.”
- There was an economic or financial market backlash, and;
- It was a great time to buy bonds.
- The employment report, along with all economic reports, are subject to heavy backward revisions, and;
- The “trend” is far more important than the actual number.
More Volatility – Still No Movement
Last week, I discussed the issue of “lot’s of volatility with little movement” stating:
“The last couple of weeks have experienced a sharp rise in price volatility. While stocks have vacillated in a very tight 1.5% trading range since the beginning of June, there has been little forward progress to speak of. However, notice that support at 2415 (50-dma) has remained solid as ‘robots’ continue to execute their program of ‘buying the dips.'”

“This lack of progress keeps us ‘stuck’ with respect to portfolio positioning.”
I remain very cautious on the overall market, currently, and the deterioration is leadership remains concerning. However, the trend remains bullishly biased which keeps portfolios allocated on the long side for now.
With that said, the recent “sideways” movement has NOT worked off the previous overbought condition of the market on an intermediate term basis as shown below.

As I have stated previously, the presence of the primary “sell signal” (signal 1) has suggested price weakness in the market would likely continue. However, the recent corrective action has now pushed the “secondary” signal towards initiation. Previously, the confluence of both intermediate-term “sell” signals have historically been in conjunction with deeper corrections in the market.
I am giving the market a bit of “room,” given the week was interrupted by a holiday which tends to let the “inmates run the asylum.” Next week will give us a better picture of the current risk/reward setup.
Despite the uptick in volatility last week, volatility remains suppressed at historically low levels. As shown in the chart below, the recent “back and forth” action has reduced the overbought condition of the market short-term with stocks testing the bullish uptrend. Furthermore, while the market is oversold on a “daily” basis, versus “weekly” as noted above, the high-level of complacency DOES NOT align with the tradeable set ups noted previously by the vertical red dashed lines.

Let me reiterate from last week:
“I continue to suggest a healthy regimen of risk management practices in portfolios by following some rather simple guidelines (the same ones that we followed to harvest profits recently as noted above.)
For now, as noted above, let’s wait until next week to see if the “bears” can continue to gain on the “bulls.” If they do, we will then begin to evaluate models to reduce overweight positions, raise some additional “cash” and potentially begin to deploy some hedges.
Approaching A Bond Buying Opportunity
Last week, I discussed “why” interest rates can NOT much substantially higher from current levels. To wit:
“As I have discussed many times in the past, interest rates are a function of three primary factors: economic growth, wage growth, and inflation. The relationship can be clearly seen in the chart below by combining inflation, wages, and economic growth into a single composite for comparison purposes to the level of the 10-year Treasury rate.”

“As you can see, the level of interest rates is directly tied to the strength of economic growth and inflation.”
This week, I want to look at interest rates from a purely technical point. Interest rates, like stock prices, are bound by the laws of physics. Prices can move only so far in one direction, before eventually returning to the mean. When rates plunged from 2.6% to 2.15% recently, bond prices had become extremely overbought and some correction action was expected.
I have been recommending to readers over the last couple of months to withhold adding bond positions given the level of richness in bond prices. That advice has played well, and the recent spike in interest rates has pushed bond prices to important levels of support while reducing much of the previous overbought condition.

As noted last week:
“However, bonds are not yet oversold. Therefore, we will hold off on adding to existing bond exposures, or adding new positions, this week with the expectation rates could rise a bit further.”
The rise in rates last week has pushed the 10-year yield to some of the highest “overbought” conditions witnessed in the past 25-years. Each time rates have been at these levels previous TWO things have happened.

Sure. Maybe this time IS different and rates will “magically” decouple from the underlying drivers of economic and inflation and go spiraling higher. Such an event would last about 37-seconds until higher borrowing costs choke off what bit of nascent economic growth we currently have.
As David Rosenberg noted this past week:
“In fact, when you go back and look at the announcements of QE1, QE2, and QE3, the Treasury market actually did not rally on these … but the stock market sure did! And you know what, in those intermittent periods when the Fed stopped its balance sheet expansion (only to then precipitate the next round), the ensuing pullback in risk appetite and the correction in the S&P 500 actually caused the bond market to rally on the safe-haven effect!”
Furthermore, the net positioning of commercial traders also recently reached a peak LONG position in bonds, historically the reversal of such a net long, to a net short position, has denoted the peak in interest rate increases and a prime opportunity to buy bonds. That reversal has already begun.

However, as noted in the chart above, when the economy slips into the next recession, interest rates will once again join the long-term downtrend towards 1% or less.
Bonds will be the right place to be. Stocks won’t be.
So, as I stated, we are looking to BUY bonds…and will likely start nibbling at positions next week.
Interesting Tidbits
I ran across a couple of interesting tidbits this past week that I thought were worth sharing with you. The first point comes with reference to my comments over the last couple of weeks of algorithms kicking in to buy every dip. In fact, they now appear to be hitting the “button” faster than ever. To wit:
“For dip-buyers in the S&P 500, 2017 has actually been a tough year… because there hasn’t been any. As JPMorgan (NYSE:JPM) notes, 2017’s 3% intra-year decline is the smallest since 1980 (tied with 1995 which saw a 34% return)”

“This 3% drawdown (for now), continues a 6-year streak of drawdowns that are dramatically below the longer-term average of 14.1% drops intra-year.”
The question is what happens when the Federal Reserves quits injecting capital into the market through reinvestment and begins to allow their balance sheet to reduce? As I have noted previously, there is a very high correlation between those reinvestments and subsequent market action.

Secondly, the Fed has suddenly become concerned about valuation pressures. This is interesting given the Fed has not given valuations much concern previously suggesting the “low interest rates supported higher valuations.”

However, in the most recent release of their Monetary Policy Report for July, it was noted:
“Valuation pressures across a range of assets and several indicators of investor risk appetite have increased further since mid-February. However, these developments in asset markets have not been accompanied by increased leverage in the financial sector, according to available metrics, or increased borrowing in the nonfinancial sector. Household debt as a share of GDP continues to be subdued, and debt owed by nonfinancial businesses, although elevated, has been either flat or falling in the past two years.”
I am not sure exactly what debt metrics she’s looking at, but leverage is currently at the highest level on record.

Furthermore, even looking at the S&P 500, 400, S&P 600 and Russell 2000 indices based on FORWARD OPERATING earnings estimates 2-YEARS into the future, I simply could not find a more generous measure of valuation, stocks are expensive. If EPS estimates fail to meet future expectations (which they always do) valuations will increase further.

Are stocks expensive? Yes.
Are companies and individuals heavily leveraged? You bet.
Will the outcome be benign? Probably not.
Lastly, while the “jobs report” was decent on Friday, with the exception of wage growth, it is important to remember two things:
In regards to point 1) – the corporate tax receipts through April contracted the most since 2009. This suggests the macro corporate environment is weaker than currently believed and hiring generally does not “ramp up,” outside of temporary factors, if the overall environment is weak.

As to point 2), it should not come as a surprise the trend of employment has clearly begun to weaken. This has historically coincided with the Federal Reserve starting a rate hiking campaign which tightens monetary policy. Why everyone believes this time is different is beyond me?

As Dr. Lacy Hunt recently stated:
“When the Fed tightens, they are saying the economy is doing too well by our standards… we want the economy to have less money and credit growth and we want less economic activity. They are saying this at a time when the best economic indicators are in a downturn.’’
The Fed has likely got it wrong…again.
See you next week.
Market & Sector Analysis
Data Analysis Of The Market & Sectors For Traders
S&P 500 Tear Sheet
The “Tear Sheet” below is a “reference sheet” provide some historical context to markets, sectors, etc. and looking for deviations from historical extremes.
If you have any suggestions or additions you would like to see, send me an email.

Performance Analysis
New! Thank you for all the comments on the performance analysis below. Due to many of the emails I got, I have swapped out the sector weight graph for a year-to-date performance range analysis. Keep the comments coming.

ETF Model Relative Performance Analysis

Sector Analysis
As I suggested last week, while the major indices remain within striking distance of all-time highs. The internal damage continued again this week.

Technology, Discretionary, Utilities, and Staples continued their recent weakness, with all sectors having now BROKEN their respective 50-dma’s. The correction does set up a potential trading opportunity provided support holds, but the break below the 50-dma raising a warning flag. If current supports in these sectors give way, we will recommend reducing overall portfolio weightings.
Financials, Health Care, Materials, and Industrials continue to catch rotation flows from the previous leaders. All of these sectors remain overbought so some profit-taking and rebalancing is advised.
Energy – Oil prices rallied last week, as I discussed in the previous newsletter, but failed at resistance. Furthermore, despite the rally in oil prices, energy stocks continue their downward trajectory. The supply of oil remains a problem with rig counts rising and economic weakness prevalent. With a major sector sell signal, and the cross of the 50-dma below the 200-dma, we remain out of the space for the time being. Use any rally to reduce exposure accordingly until the technical trends improve.
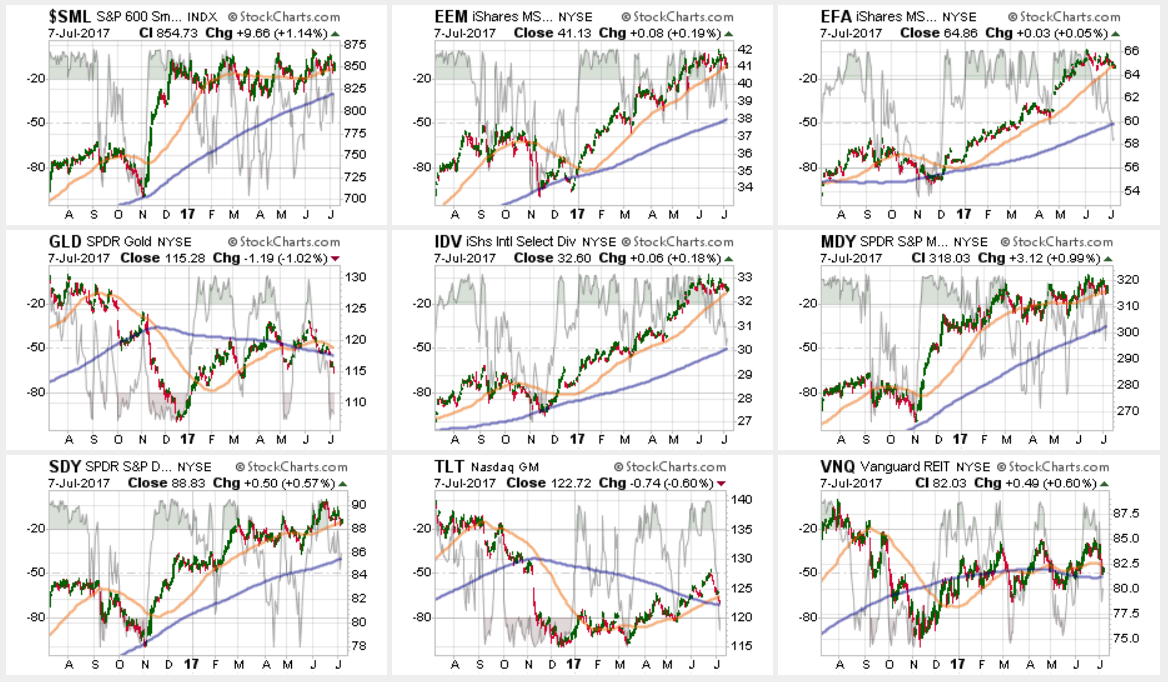
Small and Mid-Cap stocks regained their respective 50-dma’s which removes their warning signs but remained weak relative to the broader market. This keeps concern elevated at the moment, however, maintain exposure for now, but do so cautiously with stops at support.
Emerging Markets and International Stocks as noted last week:
“There is a good bit of risk built into international stocks currently. We took profits a few weeks ago, but the recent extension suggests another round of rebalancing is likely wise. Take profits and rebalance sector weights but continue to hold these sectors but stop levels should be moved up to the 50-dma. A pull back to support will provide an opportunity to rebalance holdings in the short-term. The consolidation in industrialized internal markets is bullish and a potential point to add exposure may be approaching.”
The profit taking exercise proved prudent and the international exposure has pulled back to support at the 50-dma. However, the markets are still in a corrective process and not oversold as of yet. We are looking to add some additional exposure to the international area in portfolios but will wait and see if supports hold next week.
Gold – The failure of the precious metal at critical resistance of 1300/oz keeping us out of our long-term positions currently. The short-term trading positions were also stopped out on the drop below $1260/oz for now. With Gold back below the 50- AND 200-dma, we remain OUT of gold currently.
S&P Dividend Stocks, along with other more interest rate sensitive sectors, are being sold on the technical bounce in interest rates this past week. We have recommended previously taking profits in these sectors which now provides an opportunity to add exposure at a lower cost as this opportunity develops. Continue to hold current positions but maintain stops at the recent lows.
Bonds and REIT’s were hit with the technical bounce in rates. As noted above, we have been waiting for a reasonable opportunity to add bond, and interest rate sensitive, exposure to portfolios opportunistically. With these sectors now oversold, the opportunity to begin adding exposure is approaching. We are looking for yields to rise towards 2.4% to 2.5% ultimately, but will likely begin nibbling at exposure next week.
The table below shows thoughts on specific actions related to the current market environment.
(These are not recommendations or solicitations to take any action. This is for informational purposes only related to market extremes and contrarian positioning within portfolios. Use at your own risk and peril.)

Portfolio Update:
The bullish trend remains positive, which keeps us allocated on the long side of the market for now. However, more and more “red flags” are rising which suggests a bigger correction may be in the works over the next couple of months.
Two weeks ago, during the correction, we added modestly to our core holdings for the second time this year. However, we are still maintaining slightly higher levels of cash currently.
If the markets fail to hold their 50-dma next week, we are going to begin adding further hedges to portfolios and looking to reduce accelerated volatility in the market. Stops have been raised to trailing support levels and we continue to look for ways to “de-risk” portfolios at this late stage of a bull market advance.
We remain invested. We just remain cautious and highly aware of “risks” to capital.
THE REAL 401k PLAN MANAGER
The Real 401k Plan Manager – A Conservative Strategy For Long-Term Investors

There are 4-steps to allocation changes based on 25% reduction increments. As noted in the chart above a 100% allocation level is equal to 60% stocks. I never advocate being 100% out of the market as it is far too difficult to reverse course when the market changes from a negative to a positive trend. Emotions keep us from taking the correct action.

Weaker Markets Push 2nd Sell Signal
As noted in the pie charts above, there are 4-signals that drive the portfolio allocation model. The first is a warning sign, the 2nd, 3rd and 4th, driving reductions in the equity allocation to reduce risk in 401k plans. We run this model much more conservatively than our client models due to investment selection and trading restrictions.
After another week of “up and down,” the markets continue to tread in a very tight trading range. The lack of forward motion keeps models on hold this week as internal deterioration continues, but more importantly, has pushed the 2nd “sell signal” close to triggering. Given that models currently remain with a higher level of cash, this will not require any further action at this time. But given the signal is potentially being triggered at a very high level, it is worth paying attention to.
As opposed to our portfolio model allocations, where we have more flexibility in movement, we look for opportunities to adjust risk exposure with a view of a 90-day holding period. (This is due to 401k trading restrictions. If we cannot get comfortable with a 90-day outlook, we will remain on hold.)
Opportunity Arises: As I penned last week:
“After weeks of refraining from adding further fixed income holdings, and taking profits, the pop in interest rates will provide an entry point potentially in the next week or so. Stay tuned. “
As noted in the main body of the missive above, we are looking to start nibbling at adding bond exposure to portfolios. Bond allocations can now be rebalanced toward full allocations but do so incrementally as rates rise toward our target range of 2.4-2.5%.