Last week, at the same time that the Dow had been hitting an all-time high, the Russell 2000 had been crossing below its long-term 200-day trendline. This particular divergence between U.S. large-cap stocks and U.S. small-cap stocks has only occurred on two other occasions over the past four-and-a-half decades — in early 2000 and in the summer of 2007.
The recent weakness in smaller equity investments may or may not be an indication of an eventual breakdown in the broader U.S. stock asset class. When one employs 10-year trailing price-to-earnings (P/E) ratios, U.S. stocks are more expensive than any other stock asset grouping on the planet. The last time that occurred? Early 2000.
Other fundamental indicators are equally disconcerting. For instance, the U.S. traded near 24 times its average earnings over its previous five years back at the start of the previous bear (10/07). Its 5-year trailing P/E has crept back up to 23 today.
It should be noted that the dot-com boom as well as the real estate bubble possessed characteristics that are not present in today’s environment. Not everything syncs up with the years 2000 and 2007. Irrational exuberance? Not right now. Recessionary iceberg straight ahead? Probably not.
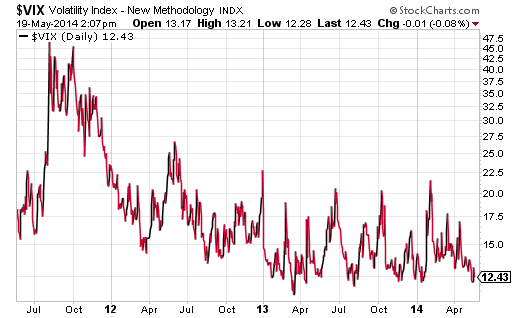
Nevertheless, it would be foolish to dismiss the technical and fundamental warning signs that exist. Even if a recession is not a probability at this juncture, contraction in the first quarter of 2014 is hardly a ringing endorsement for the well-being of the U.S. economy. Similarly, enthusiasm for U.S. stocks may not have reached the euphoric levels of 2000 and 2007, but complacency can be seen in the CBOE S&P 500 VIX Volatility Index (VIX). It is almost as if nobody believes the S&P 500 could even pull back a modest 10%.
So if I am not calling for a bear to slam U.S. stocks, what am I calling for? Relative outperformance for international equities.
In recent commentary, I provided a variety of reasons for diversifying abroad. And the evidence continues to pile up. The trailing 5-year P/E for the MSCI World ex USA Index traded at 27 back in October of 2007; it trades at 19 here in May of 2014 at a 17.4% discount to U.S. equities. Other research has been even more unfriendly to the idea that U.S. stocks are a “buy.” Research Affilliates, a firm in my neck of the woods in Orange County, CA, explains that the U.S. market is approximately 60% above its average long-term P/E. Meanwhile, countries like Brazil, China and South Korea all trade at a 20% discount to their own long-term P/Es.
In essence, it may be time to question the prevailing wisdom that one should invest in U.S. stocks because its economy represents the “cleanest dirty shirt in the laundry bin.” Stock assets from cleaner, safer economies may deserve a premium when their central banks are heavily engaged in stimulating and supporting growth. However, when a number of technical chart patterns and fundamental data demonstrate stark contrasts between foreign and domestic stocks, the so-called “clean shirt” premium may evaporate.
After three years of relative weakness, I believe foreign stocks and a number of emerging markets will outperform. Investors are beginning to see bargains. They are warming up to the possibility of government/central bank-led economic support abroad. And they are growing wary of dedicating so many eggs to the domestic basket.
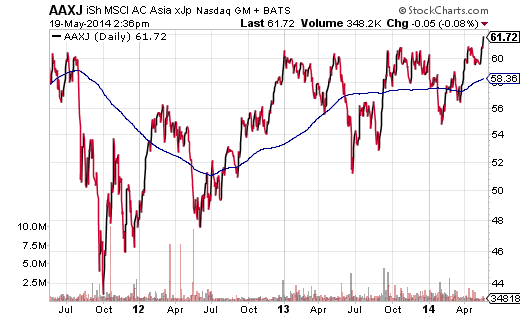
In the beginning of the year, I felt strongly about country funds like iShares MSCI New Zealand (NYSE:ENZL). More recently, I I have added capital to country funds like iShares MSCI South Korea (MX:EWY) and regional funds like iShares All-Country Asia ex Japan ((NASDAQ:AAXJ).
Granted, the prospects for further deterioration in Chinese real estate present risks to the mainland and its neighbors. On the other hand, fundamental value and technical price patterns suggest that a whole lot of the trouble may have been priced in over the last three years. Getting AAXJ for the same price as one might have paid three years earlier is a reasonable risk, particularly when one understands how to use stop-limit loss orders to protect against unfavorable outcomes.

Disclosure: Gary Gordon, MS, CFP is the president of Pacific Park Financial, Inc., a Registered Investment Adviser with the SEC. Gary Gordon, Pacific Park Financial, Inc, and/or its clients may hold positions in the ETFs, mutual funds, and/or any investment asset mentioned above. The commentary does not constitute individualized investment advice. The opinions offered herein are not personalized recommendations to buy, sell or hold securities. At times, issuers of exchange-traded products compensate Pacific Park Financial, Inc. or its subsidiaries for advertising at the ETF Expert web site. ETF Expert content is created independently of any advertising relationships.

