Chief market technician at MKM Partners, Jonathan Krinsky, is the latest commentator to add perspective on the trouble with U.S. small-cap stocks. He noted that roughly 80% of large-cap S&P 500 components are currently trading above their long-term trendlines (200-day), while only 40% of small-cap Russell 2000 components are above their 200-day moving averages. According to Mr. Krinsky, it marks the widest divergence between the two benchmarks since 1995.
A variety of market watchers have been pointing to the poor prospects of an asset class with an aggregate price-to-earnings ratio of 100. On the other hand, investors have been paying a substantial premium to own smaller company growth for several years irrespective of the price-to-earnings or price-to-sales data. Might the selling pressure be attributable to something other than overvaluation?
Perhaps.
Consider a number of recent concerns about the U.S. economy. “Core” retail sales fell 0.2% in April, suggesting that the treacherous winter cannot be blamed for why consumers held onto their wallets in the springtime. In the same vein, the Commerce Department originally estimated that the U.S. economy expanded ever-so-slightly in the first quarter of 2014 (0.1%). Yet estimates are being revised dramatically lower to reflect an economy that may have contracted for the first time in three years (0.6%-0.8%). While some investors may choose to look beyond “old information,” other investors may be turning squeamish on the notion of holding onto growth at any price.
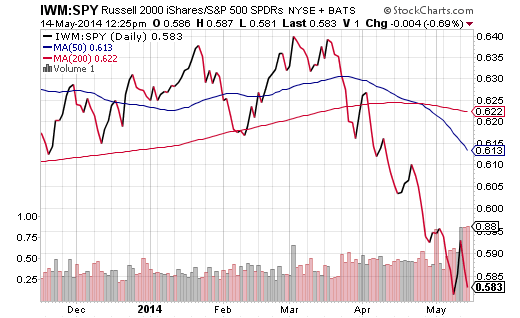
The shift away from smaller company ownership can be seen in the iShares Russell 2000 (ARCA:IWM): S&P 500 SPDR Trust (ARCA:SPY) price ratio. Relative weakness in IWM is evident in the price of IWM:SPY falling below and staying below a long-term 200-day trendline. Equally compelling? The 50-day moving average crossed below the 200-day moving average in late April, suggesting that small-caps may remain out of favor for the foreseeable future.
Equally fascinating, interest rates have moved lower in 2014. The overwhelming majority of commentators and economists projected rates would be higher by year-end. (Note: I offered my dissenting opinion in an “Against the Herd” feature this past January.) Confounded experts are blaming the Russia-Ukraine conflict. Others believe that weak economic growth is a function of unusual weather patterns, and that safety-seekers will abandon the bond market soon enough. Still others attribute bond gains (lower interest rates) to demand by pensions and large institutions, as many may have a greater need to protect principal than swing for the stock fences.
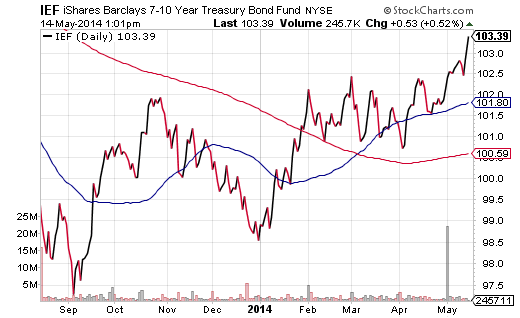
And that’s not at all. There’s the U.S, Federal Reserve’s explicit promise to keep rates low, long after tapering of quantitative easing ends. There’s even a case to be made that high frequency trading operates largely on technical chart patterns that have been favorable to bond ETF ownership. The iShares 7-10 Year Treasury Bond Fund (ARCA:IEF) is hitting year-to-date highs, while the ten-year treasury yield is at year-to-date lows (2.53%).
From my vantage point, you’re hearing a whole lot of after-the-fact excuses why interest rates are going down. An explanation that served as the origin of my original thesis on lower interest rates involved the uncertainty that comes with the central bank of the United States exiting from quantitative easing (QE). For five-and-a-half years, the Fed’s “on-again-off-again” unconventional stimulus has bellowed a familiar pattern. Specifically, assets from stocks to real estate surged higher in the early-to-mid stages of stimulus; assets from stocks to real estate faded in the later stages of stimulus and/or perceived stimulus removal.
If early birds are scaling back their risk profiles — taking profits on “Nasdaquie” equities, exiting smaller-cap securities, snatching up U.S. investment grade bonds — should you follow suit? For the most part, yes.
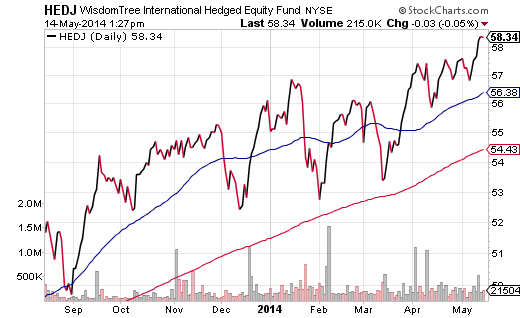
Consider shifting a portion of your allocation to more favorable trends. For instance, you can reduce small-cap U.S. exposure, while increasing low price volatility exposure in iShares USA Minimum Volatility (NYSE:USMV) and/or PowerShares MidCap Low Volatility (XMLV). Additionally, Europe is gearing up for more stimulus from its central bank and European equities are cheaper on a price-to-earnings (P/E) basis. That should provide a bit of a cushion in selecting assets like iShares MSCI EAFE Value (NYSE:EFV) or WisdomTree Hedged European Equity (NYSE:HEDJ). For those who, like myself, expect the euro-dollar to decline, HEDJ hedges against the currency risk.


