Although much of the commentary in the mainstream finance media conveys the impression that the Australian stock market is in the midst of unprecedented correction, the reality is as usual somewhat different. In fact, considering the rout in commodities prices it’s somewhat surprising that the ASX All Ordinaries and S&P/ASX 200 are still around the 5000 level. This suggests to me that the market is probably near a multi-year low and that despite all the pessimism, it’s unlikely to finish the year lower.
Last year I expected the Australian stock market to post a modest gain. By the middle of the year this forecast looked too low and plenty of commentators were predicting the ASX All Ords/ASX 200 would push beyond 6000. However the fall in commodities prices turned into a rout and dragged the All Ords/ASX 200 back near 5400.
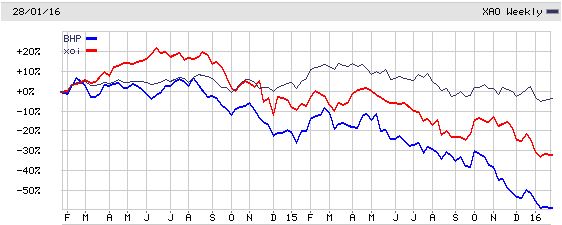
I certainly did not expect BHP Billiton (L:BLT) shares to sink under $20 nor Crude Oil to go under USD $30 a barrel. I did however predict that commodity prices would fall and that highlights the problem with all forecasts – you can make the right call, but still be wrong.
The chart above is a good way to view how commodities prices have fallen during the last couple of years. From around Q3 2014 the trend has been all downhill although it did look like prices might stabilise in early 2015. But as the year progressed the commodities rout continued and dragged down the ASX All Ords (XAO) as well.
Despite this, the Australian stock market held up relatively well. The ASX All Ordinaries Index started the year at around 5400 and finished at around 534o – so although it fell back slightly it was certainly not as bad as some media reports suggested. If we factor in dividends then long term investors would most likely have done better from stocks in terms of income than having cash in the bank.
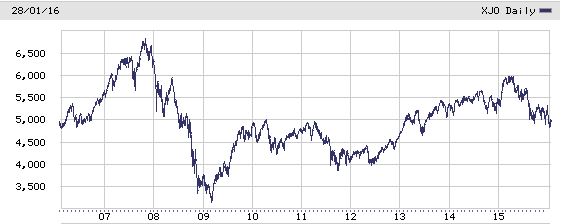
If we step back even further and look at the 10-year view of the ASX 200 then it’s clear the recent correction really isn’t that special or unusual.
As with all stock market charts there are multiple ways of looking at them depending on what time-frame we focus on. For example if we look at just the last year of the above chart, then the outlook appears very bad and one could conclude that the market is set to fall further.
My view however is that it’s just another correction and is not directly comparable to the correction seen during the global financial crisis in 2008-2009. I appreciate we are in a period when scary market predictions are popular, but as far as the Australian stock market is concerned the outlook for 2016 is actually quite positive.
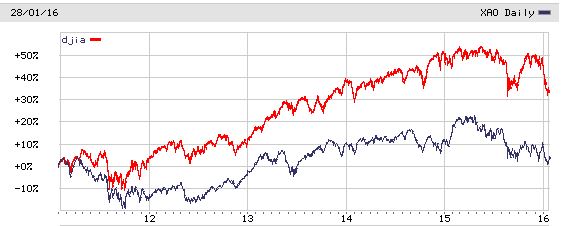
Some years ago I wrote that the U.S. Dow Jones Industrial Average Index (DJIA) would outperform the Australian ASX All Ordinaries Index and as the chart above indicates, that’s basically what has happened. But during the next few years we may seen that situation being reversed as the era of low interest rates and quantitative easing (QE) in the U.S. draws to an end.
Also during the next 12 months I expect commodities prices to recover some lost ground and by the end of 2016 my forecast for oil is to be around USD $40-50 a barrel and iron ore to be around USD $60 per tonne or higher.
Based on this mild recovery in commodities prices, my forecast is for the ASX All Ords/ASX 200 to finish the year in the 5400-5600 range or gain between approximately 8-10%. That may seem like a somewhat bullish call looking at the market today, but it’s simply a move back towards the long term trend and will still leave the market well below the last bull market high reached in 2007.


