The fact that Q1 estimates came down over the last couple of months is not something unique to the period. This has been the trend for quite some time and has become particularly notable over the last couple of years as management teams have been consistently providing weak guidance, causing estimates to come down.
One could cite a variety of reasons for why this has been the norm lately, but the most logical though cynical explanation is that management teams have a big incentive to manage expectations. After all, it pays to under-promise and over-deliver.
The chart below shows this trend clearly. The dark green column shows the earnings growth expected at the start of the quarter; the orange column shows the growth rate expected by the time the earnings season gets underway and the shaded green column shows the actual growth achieved that quarter. For 2015 Q1, we started at +4% in early January, which has effectively flipped by now. But if history is any guide, then the actual growth rate will likely be in the vicinity of where we started out in January. Other than 2014 Q4, this has been the pattern repeatedly in recent quarters.
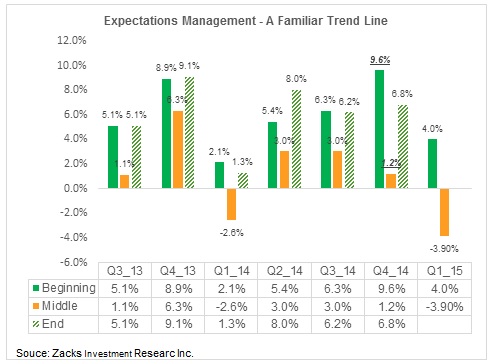
Keep in mind however, that while the trend of negative revisions is no different from other recent periods, the magnitude of negative revisions for 2015 Q1 exceeds any other recent quarter by a big margin.
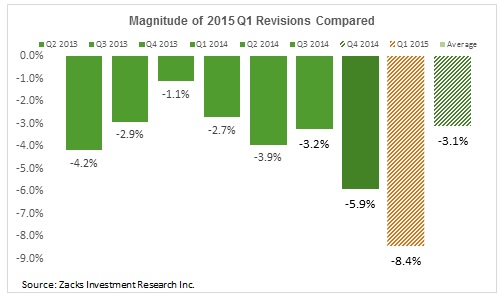
The chart below shows the magnitude of negative revisions for each quarter since 2013 Q2. As you can see, 2015 Q1 estimates have fallen -8.4% since January 1st, the most of any other recent quarter in the comparable period. Please note that the ‘average’ represents the average for the 7-quarter period through 2014 Q4.
Chart 1: The Magnitude of 2015 Q1 Earnings Revisions Compared
The Energy sector’s travails resulting from the sharp drop in oil prices are well known; we saw that in the sector’s performance in the last earnings season as well, when total earnings for the Energy sector were down -17.3% on -13.5% lower revenues. The Energy sector was a drag on the aggregate growth picture in 2014 Q4 and perhaps something similar was at play in the unusually high level of negative revisions in 2015 Q1 as well.
This is a valid point and the negative revisions for the Energy sector does provide a big part of the explanation for why Q1 estimates have fallen so much. After all, total earnings estimates for the sector have almost been halved since the start of the quarter in early January. The current Zacks Consensus EPS estimates for Exxon (NYSE:XOM) and Chevron (NYSE:CVX) of $0.79 and $0.74 are down -34.2% and -51.6% over the last 90 days, respectively.
But it would be wrong to blame the Energy sector alone for the outsized negative revision to Q1 estimates that chart 1 above shows. The magnitude of negative revisions to Q1 estimates is still the highest of any other recent quarter after we isolate and exclude the Energy sector from the aggregate picture. We show that in chart 2 below which compares the magnitude of Q1 estimate revisions on an ex-Energy basis.
Chart 2: Magnitude of Q1 Revisions outside of the Energy Sector
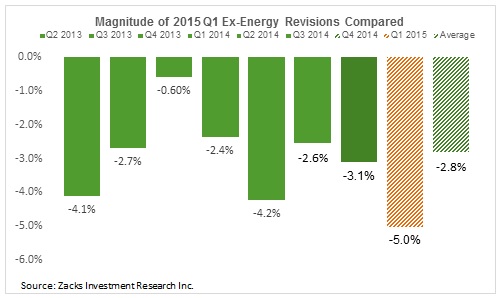
Chart 3 below looks at the same revisions trend from another angle. Instead of the magnitude of revisions in total earnings over the quarter to date period, here we are showing how the estimates of total earnings growth have evolved over this time period. We show the evolving aggregate growth picture for the S&P 500 index as a whole (green bars), as well as on an ex-Energy sector basis (grey bars).
Chart 3: Evolution of 2015 Q1 Growth Estimates
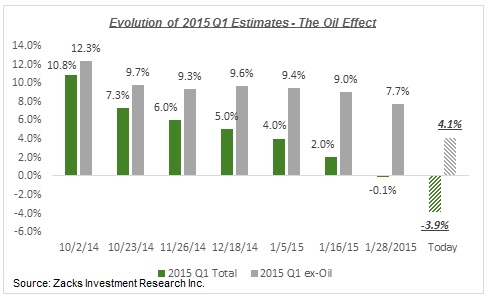
Chart 4 below shows the major sectors that have suffered the biggest negative revisions since the start of the quarter. Please note that each of the 16 Zacks sectors has suffered negative revisions; the Utilities sector has the lowest negative revision, but has nevertheless gone down.
Chart 4: Major Sectors with Big Negative Revisions
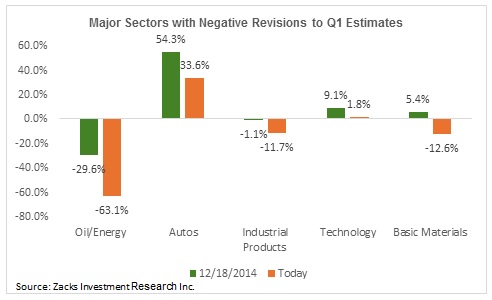
As you can see in chart 4, even the Technology sector has suffered negative revisions, with earnings for the sector now expected to be up only +1.8% from the same period last year vs. expectations of +9.1% growth at the start of the quarter. Estimates for all the key sector players like Google (NASDAQ:GOOGL), Microsoft (NASDAQ:MSFT), Intel (NASDAQ:INTC) and IBM (NYSE:IBM) have come down since January.
Are Q1 Estimates Too Low?
The pronounced downshift in Q1 estimates has prompted some on Wall Street to start claiming that the revisions trend may have a gone bit too much; meaning that estimates have likely become too low. Hard to find a basis for such a claim in real time, particularly given the global growth woes and still-high U.S dollar.
The market’s reaction to the results from the 16 S&P 500 members that have already reported Q1 results (all of these companies have reported fiscal February quarter results that get counted as part of the Q1 tally) doesn’t support the claim that estimates may be too low. The last two columns in the summary table below shows the price impact of each company’s earnings result for this quarter as well as the preceding one.
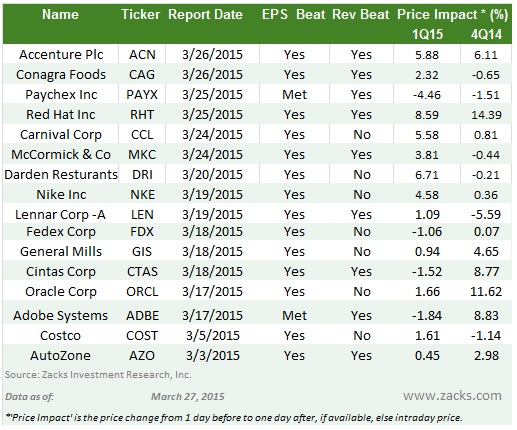
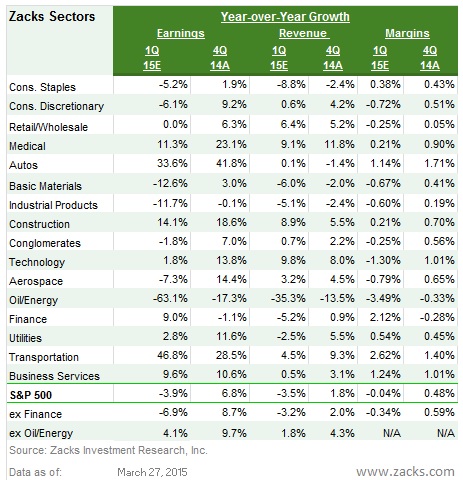
The table below presents the summary picture for Q1 contrasted with what companies actually reported in the 2014 Q4 earnings season.
Will Q1 be the Low Point for the Year?
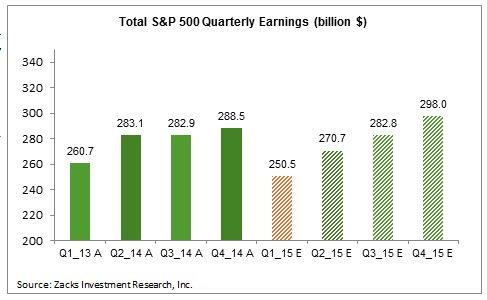
We haven’t had much earnings growth lately and current estimates put the growth rate for Q1 to turn negative. But the overall level of total earnings has been very high in recent quarters. In fact, total earnings for the S&P 500 index were an all-time record in 2014 Q4 and the preceding two quarters were all-time records at their respective times as well. But we are taking a big detour from that trend in Q1, with total earnings for the index expected to be the lowest in two years.
The chart below shows the earnings totals for 2015 Q1 (shaded orange bar - $250.5 billion) contrasted with the actual earnings for the preceding four quarters as well estimates for the following three quarters. The hopes are that Q1 will be the low point for the year, with aggregate earnings moving back into record territory towards the end of the year. Recent history tells otherwise. If history is our guide, then the likely result will be revisions to those lofty estimates in the coming days.
This Week’s Reporting Calendar
As mentioned earlier, companies with fiscal quarters ending in February have been reporting quarterly results already and all of those get counted as part of our 2015 Q1 tally. As of Friday, March 20th, we have seen such results from 16 S&P 500 members already. This week, we will get results from 55 companies in total, including 3 S&P 500 members.
The chart below shows when 2015 Q1 earnings reports will come out on a weekly basis.
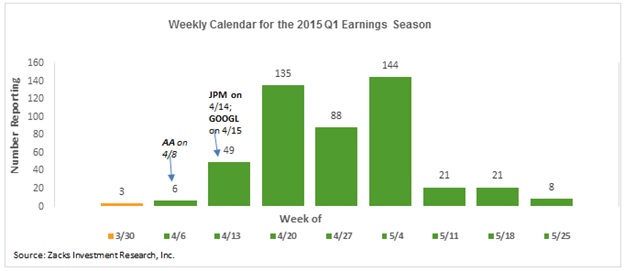
Here is a list of the 55 companies reporting this week, including 3 S&P 500 members.
| Company | Ticker | Current Qtr | Year-Ago Qtr | Last EPS Surprise % | Report Day | Time |
| CYPRESS EGY PTR | CELP | 0.34 | N/A | -30.23 | Monday | BTO |
| UTI WORLDWIDE | UTIW | -0.07 | -0.15 | -260 | Monday | BTO |
| NORCRAFT COS | NCFT | 0.18 | N/A | 0 | Monday | BTO |
| FIFTH STREET AM | FSAM | 0.25 | N/A | 14.29 | Monday | BTO |
| CAL-MAINE FOODS | CALM | 1.06 | 0.88 | N/A | Monday | BTO |
| CHINA NEPSTAR | NPD | -0.01 | 0.02 | 0 | Monday | BTO |
| AAR CORP | AIR | 0.41 | 0.4 | 2.7 | Monday | BTO |
| SPHERE 3D CORP | ANY | -0.14 | N/A | N/A | Monday | AMC |
| ARGOS THERAPEUT | ARGS | -0.79 | -36.19 | -18.46 | Monday | AMC |
| ATOSSA GENETICS | ATOS | -0.11 | -0.15 | N/A | Monday | AMC |
| RXI PHARMACEUT | RXII | -0.14 | -0.36 | N/A | Monday | AMC |
| ONE GROUP HOSP | STKS | 0.11 | 0.07 | N/A | Monday | AMC |
| YOUNGEVITY INTL | YGYI | N/A | 0 | N/A | Monday | AMC |
| MEDLEY MGMT INC | MDLY | 0.28 | N/A | 0 | Monday | AMC |
| GOL LINHAS-ADR | GOL | -0.15 | -0.03 | -55.56 | Monday | N/A |
| BG MEDICINE INC | BGMD | N/A | -0.06 | N/A | Tuesday | BTO |
| CONNS INC | CONN | 0.63 | 0.74 | -111.76 | Tuesday | BTO |
| SCIENCE APP INT | SAIC | 0.71 | 0.66 | 4.05 | Tuesday | BTO |
| OPTIMIZERX CORP | OPRX | 0.01 | 0 | N/A | Tuesday | BTO |
| VERTEX ENERGY | VTNR | -0.11 | 0.11 | N/A | Tuesday | BTO |
| CELLADON CORP | CLDN | -0.36 | -7.96 | -2.56 | Tuesday | BTO |
| ELEPHANT TALK | ETAK | -0.03 | -0.05 | 0 | Tuesday | BTO |
| INTELGENX TECH | IGXT | -0.01 | -0.01 | N/A | Tuesday | BTO |
| SORL AUTO PARTS | SORL | 0.12 | 0.05 | 0 | Tuesday | BTO |
| MOVADO GRP INC | MOV | 0.2 | 0.46 | 0 | Tuesday | BTO |
| WILLDAN GROUP | WLDN | 0.26 | 0.09 | 88.89 | Tuesday | AMC |
| CYTOSORBENTS CP | CTSO | -0.21 | -0.25 | 0 | Tuesday | AMC |
| LANDEC CORP | LNDC | 0.17 | 0.24 | -7.69 | Tuesday | AMC |
| FRESHPET INC | FRPT | -0.03 | N/A | 22.22 | Tuesday | AMC |
| IMMUNE DESIGN | IMDZ | -0.68 | N/A | -52.78 | Tuesday | AMC |
| SYNNEX CORP | SNX | 1.52 | 1.25 | 7.65 | Tuesday | AMC |
| ADCARE HLTH SYS | ADK | -0.05 | -0.12 | -150 | Tuesday | AMC |
| FLEXIBLE SOLTNS | FSI | 0.02 | 0.19 | 0 | Tuesday | AMC |
| HOPTO INC | HPTO | -0.01 | -0.01 | N/A | Tuesday | AMC |
| NOVAGOLD RSRCS | NG | -0.02 | -0.03 | 50 | Tuesday | AMC |
| PIONEER PWR SOL | PPSI | 0.14 | 0.17 | 55.56 | Tuesday | AMC |
| PARAGON SHIPPNG | PRGN | -0.34 | -0.12 | -8.7 | Tuesday | AMC |
| QUEST RES HLDG | QRHC | -0.01 | -0.02 | -150 | Tuesday | AMC |
| REAL GOODS SOLR | RGSE | -0.16 | -0.05 | 78.57 | Tuesday | AMC |
| TRUE DRINKS HLD | TRUU | -0.05 | N/A | 16.67 | Tuesday | AMC |
| MONSANTO CO-NEW | MON | 2.96 | 3.15 | 38.24 | Wednesday | BTO |
| ACUITY BRANDS | AYI | 1.06 | 0.75 | 14.78 | Wednesday | BTO |
| UNIFIRST CORP | UNF | 1.3 | 1.27 | 10.12 | Wednesday | BTO |
| TITAN PHARMA | TTNP | -0.01 | 0 | 50 | Wednesday | BTO |
| IAO KUN GROUP | IKGH | 0.04 | -0.06 | 60 | Wednesday | BTO |
| SPORTSMANS WRHS | SPWH | 0.21 | N/A | 10.53 | Wednesday | AMC |
| NATL AMER UNIV | NAUH | 0.05 | 0.04 | -16.67 | Wednesday | AMC |
| PROGRESS SOFTWA | PRGS | 0.13 | 0.21 | 0 | Wednesday | AMC |
| SIGMA DESIGNS | SIGM | 0.01 | -0.17 | -50 | Wednesday | AMC |
| ROVI CORP | ROVI | 0.29 | 0.34 | 11.76 | Wednesday | AMC |
| CARMAX GP (CC) | KMX | 0.6 | 0.52 | 11.11 | Thursday | BTO |
| MICRON TECH | MU | 0.8 | 0.85 | 5.43 | Thursday | AMC |
| PERRY ELLIS INT | PERY | 0.03 | 0.06 | -50 | Thursday | BTO |
| EDAP TMS SA-ADR | EDAP | -0.01 | -0.04 | N/A | Thursday | BTO |
| FRANKLIN COVEY | FC | 0.11 | 0.12 | 0 | Thursday | AMC |
