Leading Indicators
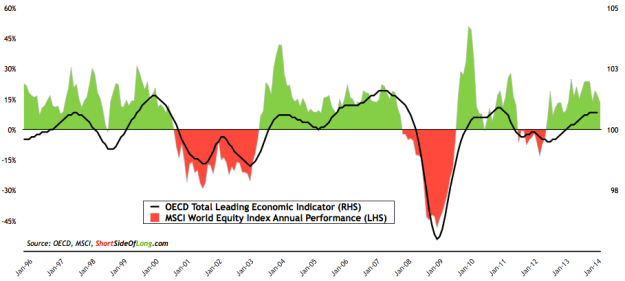
Chart 1: Recent OECD LEI update shows growth acceleration is slowing
Source: Short Side of Long
Recent OECD Leading Indicators for the month of March showed that growth acceleration since the middle of 2012 is now levelling off. Growth acceleration in the United States is slowing slightly, while we still see a continued improvement in the Eurozone countries. Emerging Market economies, and especially the BRICs, continue to deteriorate towards growth below trend. Interestingly, the MSCI World Equity Index is this out and its year-on-year performance has also started to slow. Note: Investors should remember that even though OECD prides itself on being a “leading indicator”, the stock market does a great job of anticipating changes in economic activity well before LEIs.
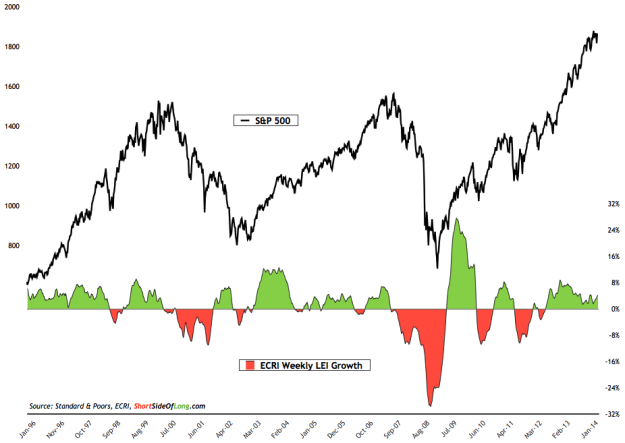
Chart 2: Weekly ECRI Indexes show slight improvement, signalling growth
Source: Short Side of Long
Recent ECRI Weekly Leading Indicators continue to improve (even if ever so slightly), confirming the US equity markets advance. The Weekly Growth Index that tries to predict future US economic activity, seen in the chart above, rose to 4.1% compared to 2.9% from a month earlier (when the last report was published). However, the Weekly ECRI Index itself, seen in last month's report, decreased in readings. Neither of the ECRI Indices are currently predicting a potential slowdown nor a recession on the horizon. Note however: ECRI LEI’s are designed to forecast U.S. economic activity, but the majority of the time they also correlate closely to the stock market and credit spreads. Therefore, it is wiser to follow the market itself.
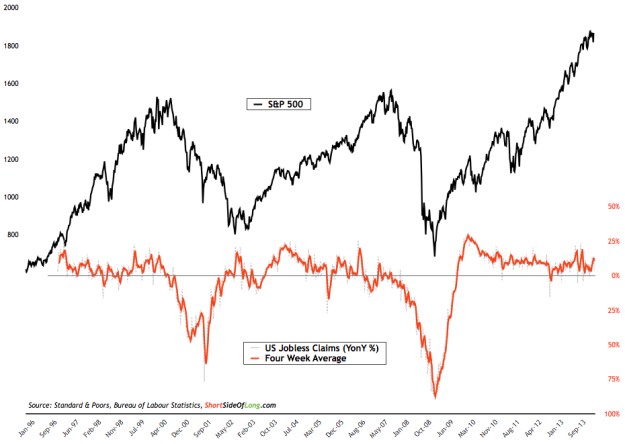
Chart 3: US jobless claims show no major deterioration in recent months
Source: Short Side of Long
US Weekly Jobless Claims, averaged over four weeks, currently stand at 317,000. The chart above shows an inverted reading of year-on- year change in initial jobless claims. As we observe the chart we can see that when jobless claims increase by around 25% from a year earlier, that usually spells trouble for the economy and the stock market. Presently, jobless claims have been slowly improving and there seems to be warning signals at present. Having said that, I would like to remind readers that investing is all about anticipating the next move and not using present data to invest for the future. The question is, how long can jobless claims keep improving before we see a negative surprise? Note: As a forward looking indicator, US weekly jobless claims anticipate the lagging economic data of non farm payrolls, and therefore hold a much closer correlation to the stock market's performance.
G3 Consumer Confidence
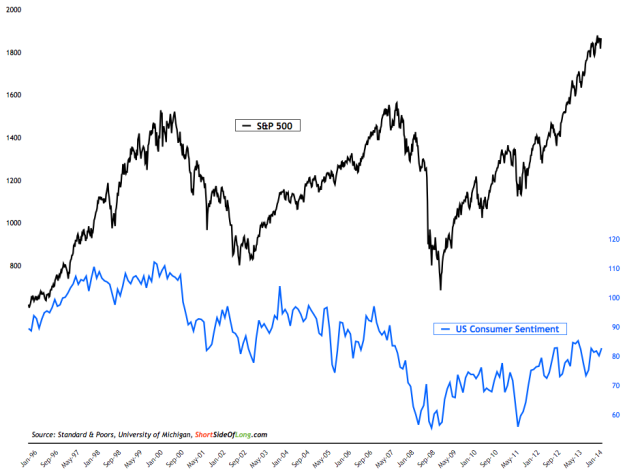
Chart 4: US consumer confidence has reached a 9 month high in April
Source: Short Side of Long
University of Michigan US Consumer Sentiment has remained in a trading range since 2012, whipsawing between 72 on the downside and 85 on the upside. April readings rose to 84.1, from 80 in March and 75.1 six months ago. I would like to remind investors that while the stock market has broken to a record high above the peaks of 2000 and 2007, consumer sentiment still remains in a downtrend, having peaked all the way back in 2000. Note: Consumer confidence is one of the best contrary indicators to time long term equity purchases and sales. US Consumer Sentiment has averaged 86.7 over the last six decades, with a record high of 112 in January 2000 (during the tech bubble peak) and record low of 51.7 in May 1980 (during the high interest rate recession squeeze).
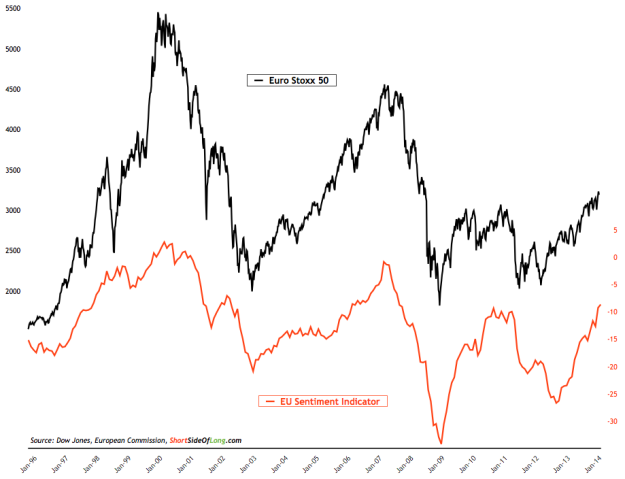
Chart 5: EU consumer confidence is now the highest since 2011!
Source: Short Side of Long
The EU Sentiment Indicator continued to improve over the last couple of months. As can be seen in the chart above, April readings rose to -8.6, from -9.3 in March and -15.3 six months ago. Consumer confidence is currently at levels last seen during 2011, just prior to the start of the EU Debt Crisis. Over the last two decades, high confidence readings are closely linked to EU equity price peaks so there is a reason to be cautious here. Note: Consumer confidence is one of the best contrary indicators against which to time long term equity purchases and sales. The EU Sentiment Indicator has averaged -12.7 over the last three decades, with a record high of 2.7 in March 2000 (during the tech bubble peak) and record low of -34.2 in March 2009 (during the GFC crash trough).
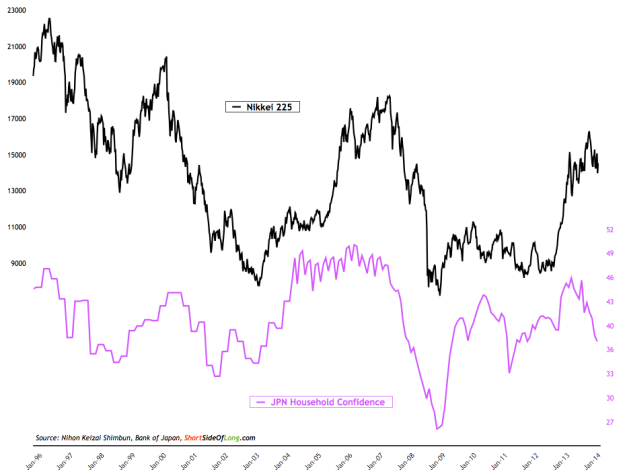
Chart 6: Japanese consumer confidence is falling due to sales tax hike
Source: Short Side of Long
Japanese Household Confidence continued its multi month decline, mirroring the volatility in the Nikkei 225. While the April readings aren’t out yet due to a delay from the Cabinet Office of Japan, March readings fell to 37.5 from 38.3 a month ago and from the peak of 45.4 in October 2013. The majority of economists blame the recent tax hikes for a fall in consumer sentiment, but an overdue stock market correction (after a powerful run up) is also a major cause. Note: Consumer confidence is one of the best contrary indicators against which to time long term equity purchases. Japanese Household Confidence has averaged 42.4 over the last three decades, with a record high of 50.8 in December 1988 (during the Japanese bubble peak) and a record low of 27.4 in January 2009 (during the GFC crash trough).
Lagging Indicators
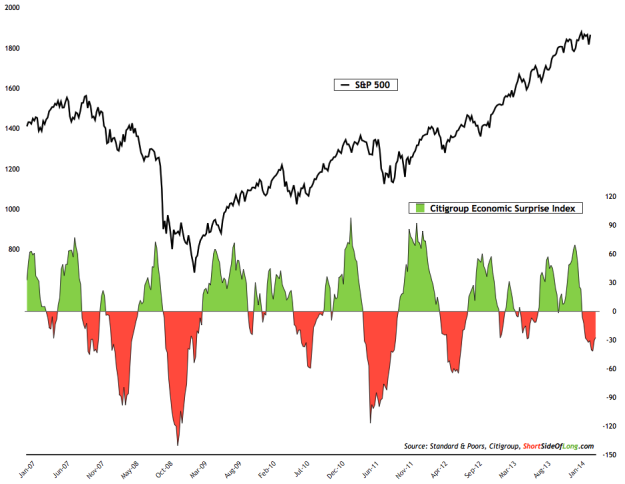
Chart 7: US economic data continues to disappoint at a very mild rate…
Note: economic data in general is lagging, while the stock market itself is a forward looking discount mechanism. That is why this section does not pay attention to industrial production, retail sales, GDP numbers, non farm payrolls or personal income. Even though the media absolutely loves tracking these data points, paying attention to the previous month's economic activity is usually irrelevant and for investors, similar to driving a car with only a rear view mirror. However, the surprise factor that the Citigroup index measures on the overall macro data is very relevant as a potential sentiment indicator against overly bullish / bearish economists.
Source: Short Side of Long
Citigroup’s US Economic Surprise Index has remained in negative territory for several weeks now, letting us know that the majority of the data still continues to surprise economists negatively. However, despite the falling Citigroup Economic Surprise Index, stock prices have not been affected at all. As I write this, S&P 500 itself is only a handful of points away from posting yet another record high.
Monthly Commentary
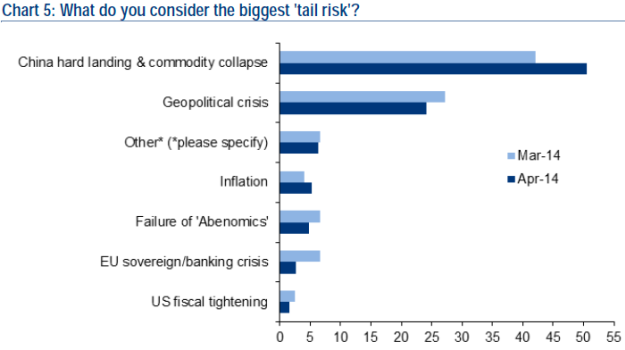
Chart 8: Global managers are losing sleep over Chinese hard landing!
Source: Merrill Lynch Fund Manager Survey
According to the recent Merrill Lynch Fund Manager Survey published in April, global fund managers have been losing sleep over a potential China hard landing. This is not a new phenomenon either, as the report has shown constant pessimism towards China for months now.
It is no secret that Chinese economy has been in a slowdown since 2010. With GDP slowing from 12% annual growth rate towards 7.4% during the recent quarter, our personal view as to whether we believe official Chinese statistics or not is irrelevant. Clearly, the growth trend points downwards and many global assets have been under-performing.
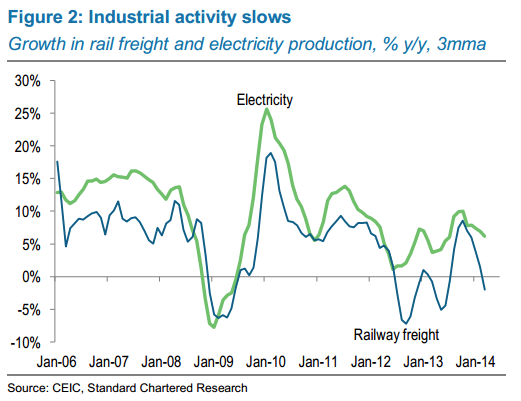
This has also been confirmed by other economic indicators, some of which Li Keqiang popularised after a Wikileaks noted that he prefers to track railway cargo volume, electricity consumption and loans disbursed by banks; instead of the “man made” GDP figures. These indicators grouped together, later came to be known as Li Keqiang Index.
Chart 9: Chinese economic activity has been very slow since start of ’10
Source: Standard Chartered Research
As we can see in Chart 9 above, recent components of the so called Li Keqiang Index have been rather weak. Railway freight is currently contracting from a year ago, while electricity production is growing at just above 5% from a year earlier. At the same time, recent loan figures show continued slowing in the month of March, with loan growth at the slowest rate since 2008 financial crisis.
While Manufacturing PMI readings have been average at best, other indicators also point to slow economic activity. Recent Producer Prices Index (PPI) remains in deflation territory and is currently down for 25th consecutive month. It seems that China is definitely working off at least some of the excesses it has built during the 2009 credit stimulus.
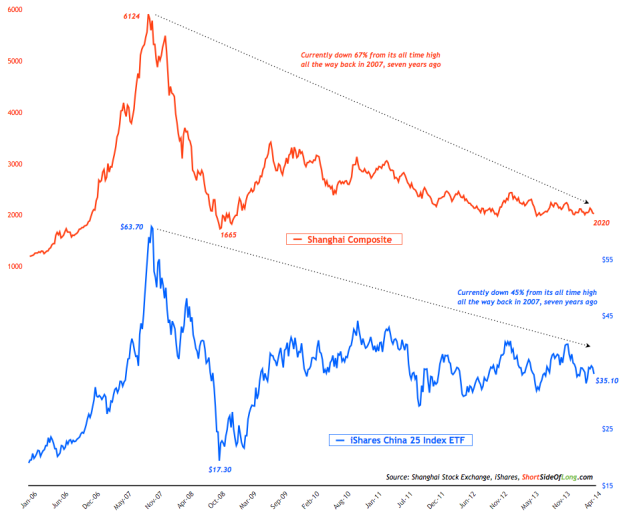
Chart 10: Chinese shares already discounting poor economic activity…
Source: Short Side of Long
The Chinese economic slowdown is a well telegraphed story that has been going on for years now. While the potential bursting of its massive credit bubble is a worry to many fund managers around the world, the most important question for investors is whether or not the Chinese stock market has discounted some (or the majority) of these worries. Improvement in economic indicators will definitely push stock prices higher, as the Li Keqiang Index closely correlates to the annual performance of the MSCI China Index.
Furthermore, Chart 10 observes that both of the Chinese stock market indices, the local Shanghai Composite and shares priced in USD (iShares FTSE/Xinhua China 25 Index (ARCA:FXI)), have been performing poorly for seven years now. They have been trading in a pattern of lower highs, constantly disappointing investors. The Shanghai Composite is currently down 67% from its all time high in 2007, while the China ETF is down more than 45% from the same time frame. Finally, worth noting is that both of these indices are trading at incredibly low valuations at present.
No one really knows if the Chinese stock market has bottomed out yet, but I would like to remind investors that periods of pessimism are almost always the best time to buy!

