A year end series taking a longer perspective in many market indexes, macro related commodities, currency and bonds. Over three weeks these reviews are intended to help create a high level road map for the the next twelve months and beyond. We continue with US Treasury Bonds (TLT).
US Treasury Bonds are seen as a measure of inflation expectations. Demand for them is also used as a proxy for risk appetite when compared to equities or lower credit bonds.
They have long been seen as a store of value and are the go-to asset on a flight to safety. The monthly chart below for my US Treasury Bond proxy, the iShares Barclays 20+ Year Treasury ETF, (TLT), shows many of these events. The spike in 2009 as the financial crisis hit. And the rise in prices as the Federal Reserve began its stimulus programs, buying bonds and mortgages.
You can also see the sharp reversal when the Fed made it known that they would shut off the faucet at some point. But there is some very interesting data there as well for the interested eye. Bonds started a shallow rising trend support in mid 2006 that continued among all these exogenous factors that pushed it around on violent moves. Look at 2002 through 2008. Just a tight narrow range as shown by the shaded box. 
The pullback that began in July 2012 is just starting to close in on that rising trend support. It bodes for a continuation to the 96 area before you can consider the very long term trend dead. A continuation below that 96 level shows support at 90.50 and 88.80 before the long term support at 82. The present trend shows no signs of stopping with a Relative Strength Index (RSI) that continues lower and a MACD that is falling. Looking more closely at the weekly chart shows there is no good news that could reverse it on this timeframe. There is a 3 Drives harmonic pattern operating with a 127% extension (purple lines) in play that would target 79.50, and a Shark harmonic that could target either 92 or 83.50 before a reversal. All three targets are below that prior rising trend support on the monthly chart. This timeframe also has the RSI looking bearish and the MACD looking like it will roll lower again after a brief rise. Drilling in further to the daily chart gives the key to the structure. The range between 102 and 108.50 has held up since late July. Treasury bonds need a break of this box for the fireworks to begin. A break below 102 will trigger the targets in the weekly and monthly charts. And a move over 108.50 will negate then and begin a leg higher. The 102 to 108.50 range is the key. Keep an eye on it.
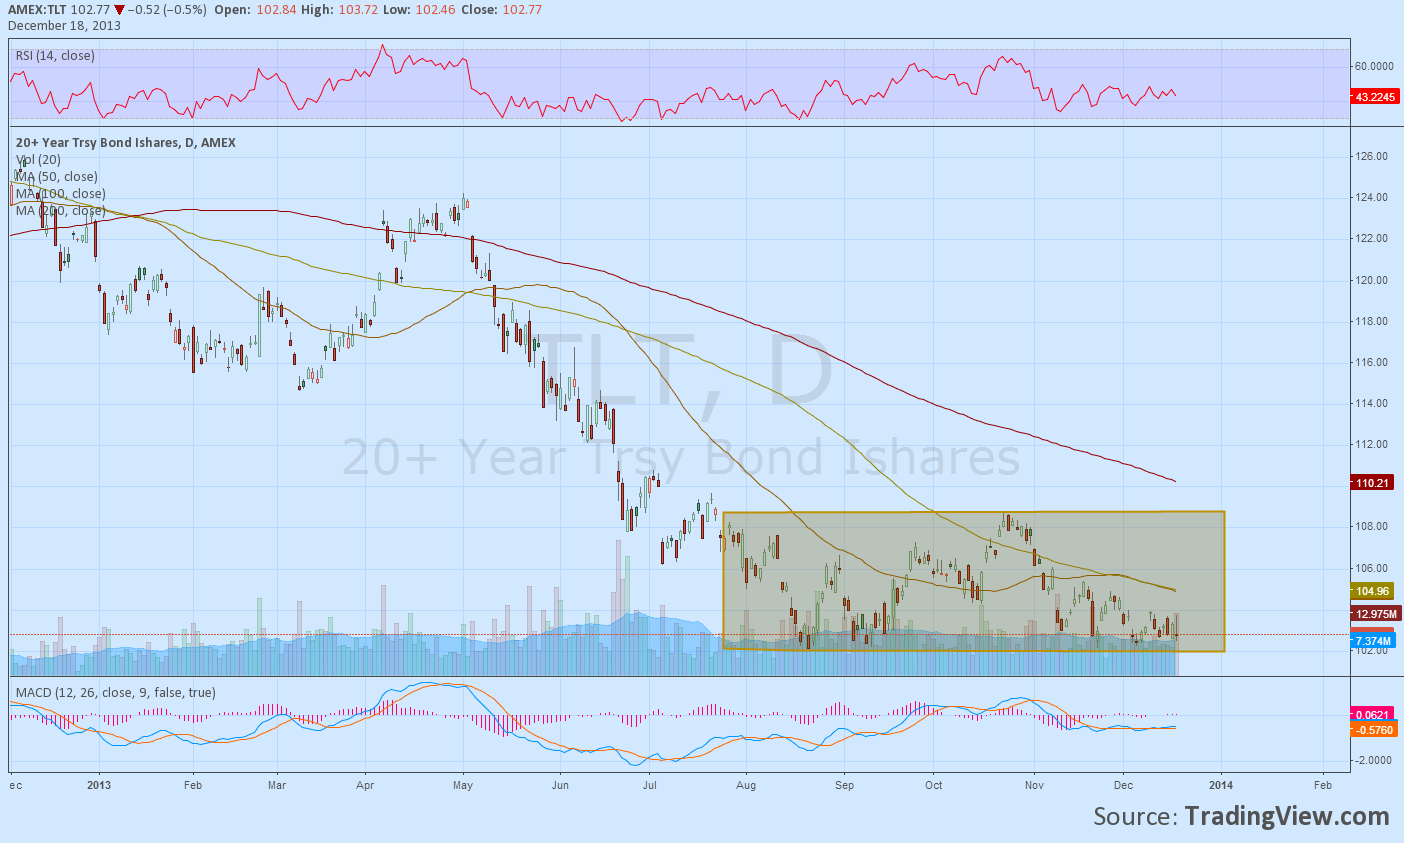
Disclosure: The information in this blog post represents my own opinions and does not contain a recommendation for any particular security or investment. I or my affiliates may hold positions or other interests in securities mentioned in the Blog, please see my Disclaimer page for my full disclaimer.
Original post