Looking For A Sign
The past few weeks have been incredibly trying. You can look at the glass as half full and half empty, and in both cases, an observer could find plenty to support either view.
An observer of a glass half full could argue that despite all the negative headlines the market has held steady, and has remained resilent. An observer that sees a glass half empty could point to the index’s inability to rise above 2935 on multiple occasions.
The part that is so difficult to grasp is what happens next. Generally speaking, I have a good sense of direction when it comes to the broader market. But lately, I feel I have lost my way. I can not determine the movement in the market, and that makes me incredibly uneasy. Why does it make anxious? Because I know the next move in the market will be a move that sends it sharply higher or lower.
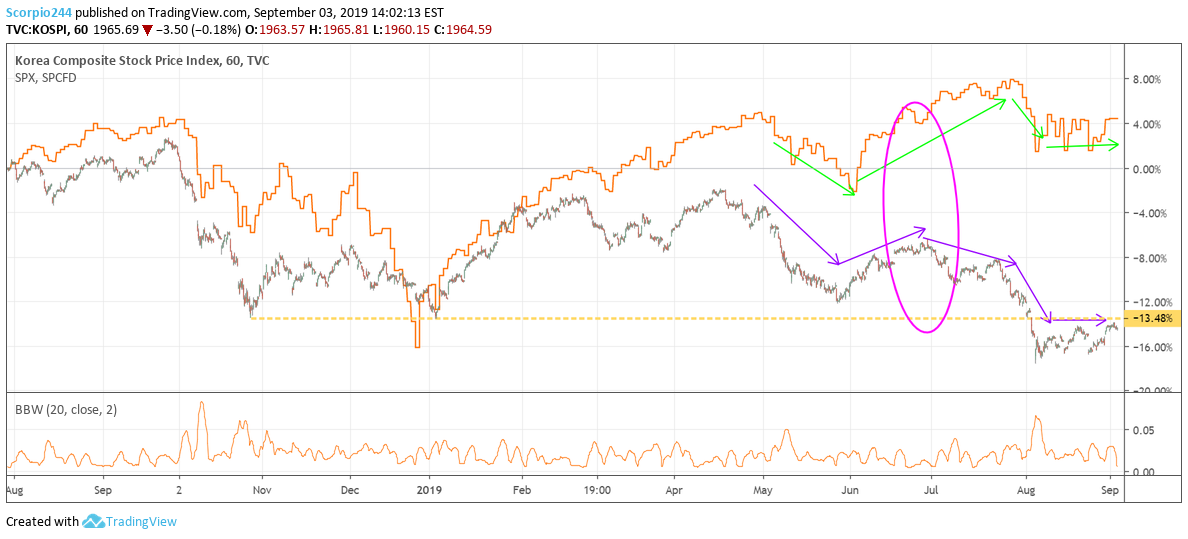
So patiently I resign myself to the fact, that looking for clues and subtleties are not easy to find. However, when looking abroad instead of finding markets that are breaking down, I’m finding markets that appear to be improving. It leaves me feeling cautiously optimistic that the summer doldrum will pass and a period of higher prices await. However, we need to remain patient for the markets next signal.
S&P 500 (SPX)
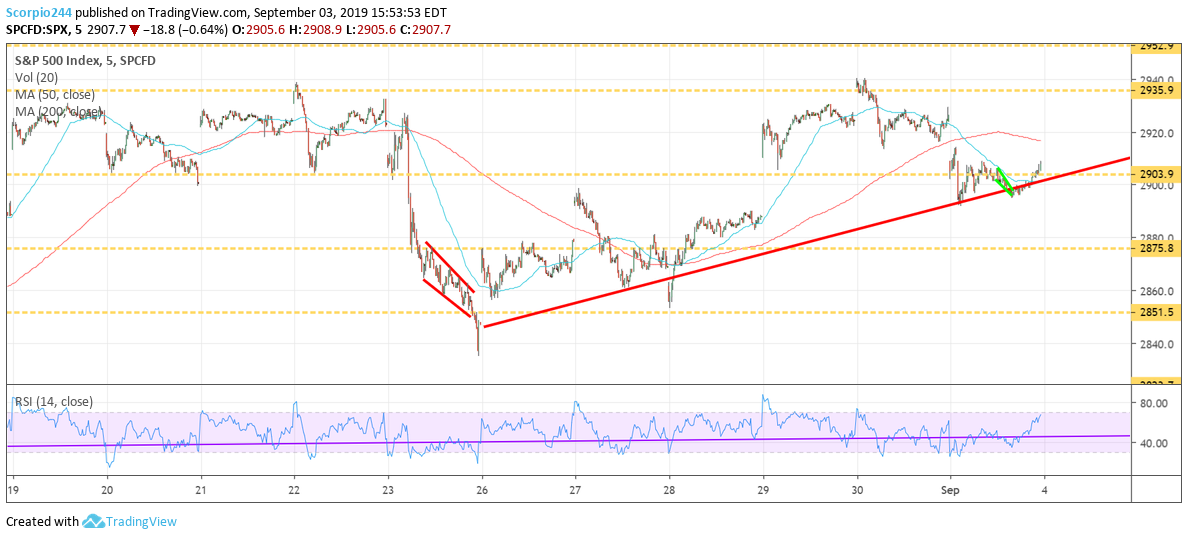
The three-ring circus continues with the S&P 500 on September 3 refilling a gap from last week. If the current pattern holds, and the trend continues to rise, then an ascending triangle is forming, which leads us to the big break out at 2935. However, if the trend doesn’t hold, and the index breaks the uptrend, then the index will fall and retest 2825.
GE (GE)
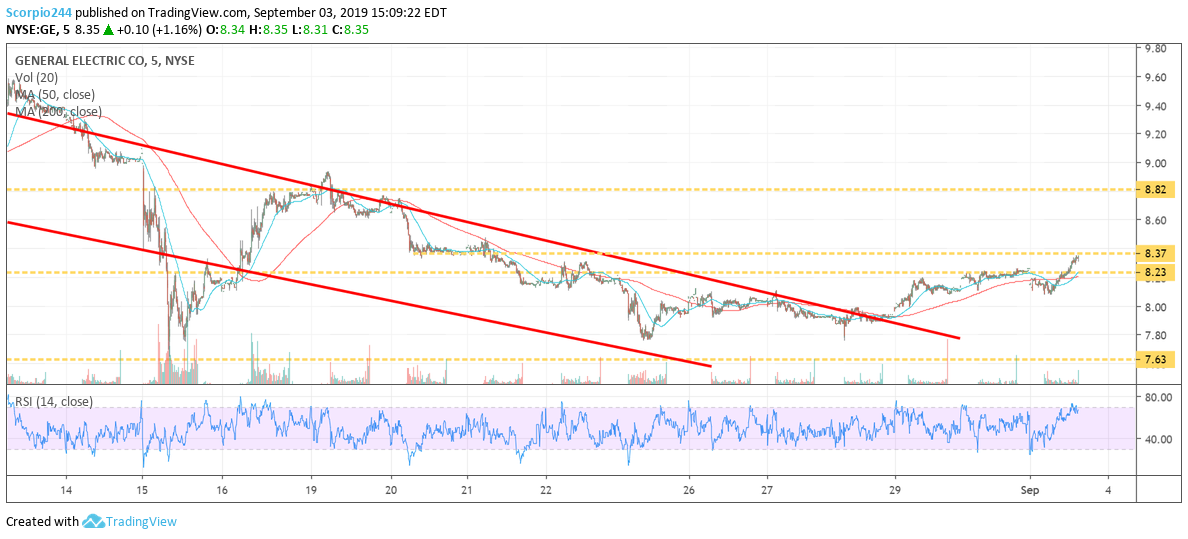
When you are off, your off. Even with the markets sharp decline, General Electric Company (NYSE:GE) still managed advance. Unreal. The last line of defense until an increase to $8.80 is around $8.40.
Square (NYSE:SQ)
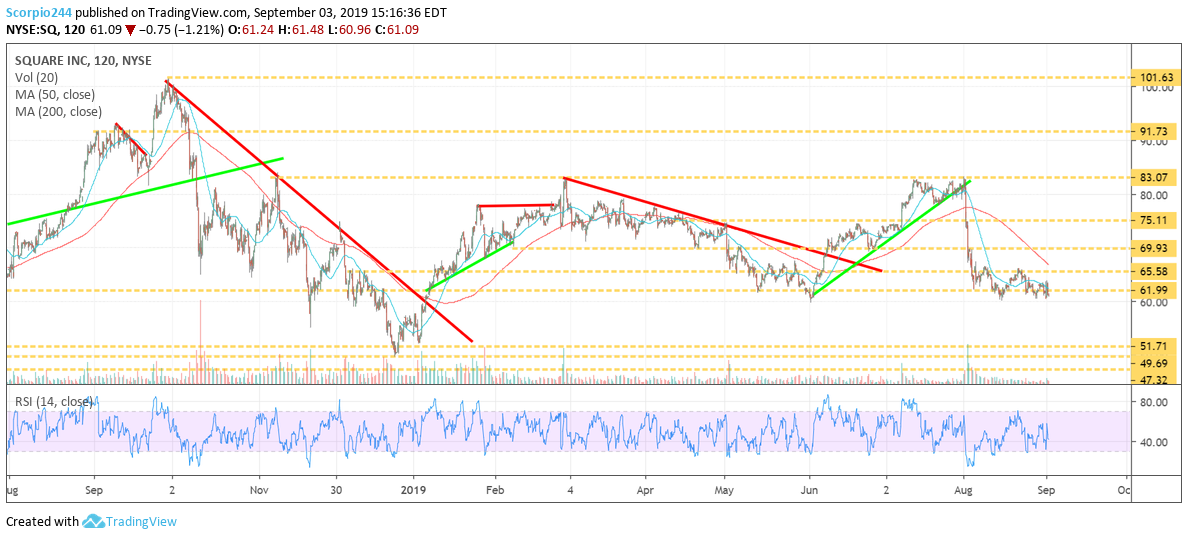
Square (NYSE:SQ) is looking very weak recently, and very close to a big break down that could send SQ much lower perhaps to around $52.
Amazon (NASDAQ:AMZN)
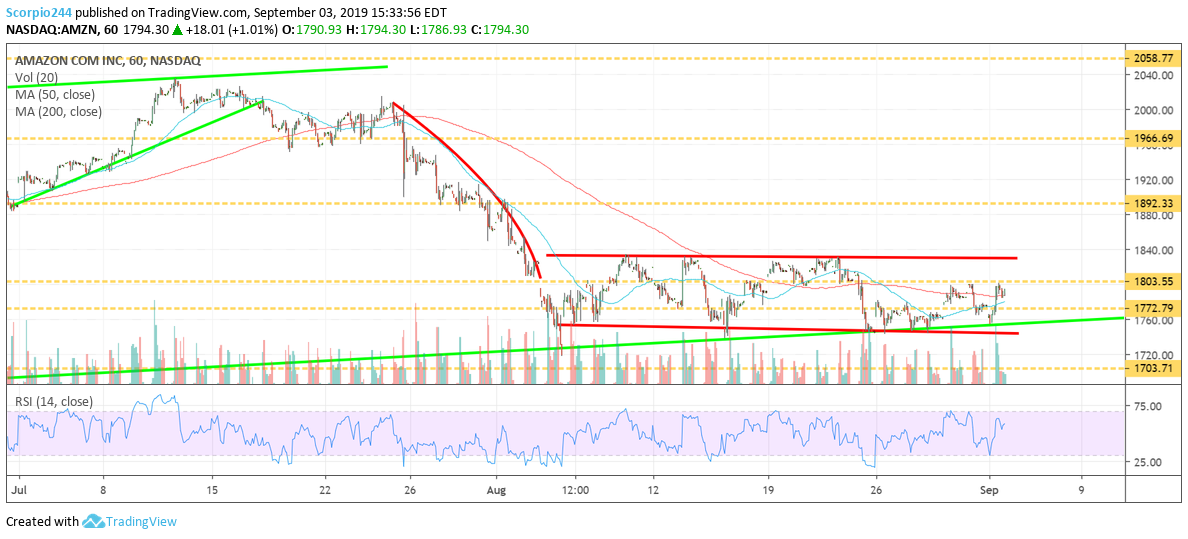
Amazon (NASDAQ:AMZN) got a big price target boost from RBC, and the stock outperformed. But again, Amazon failed at resistance at $1800, another stock that can’t get itself moving higher.
Microsoft (NASDAQ:MSFT)
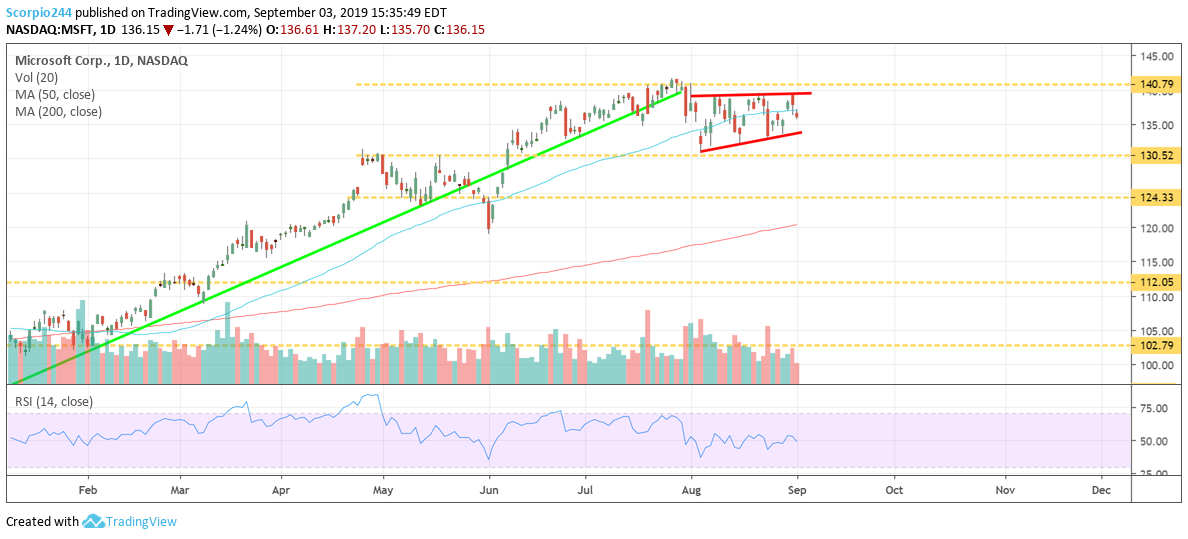
I re-drew the Microsoft (NASDAQ:MSFT) chart slightly today. It doesn’t matter much because there is nothing positive or negative forming here at this point. Resistance and support remain unchanged.
Alexion (NASDAQ:ALXN)
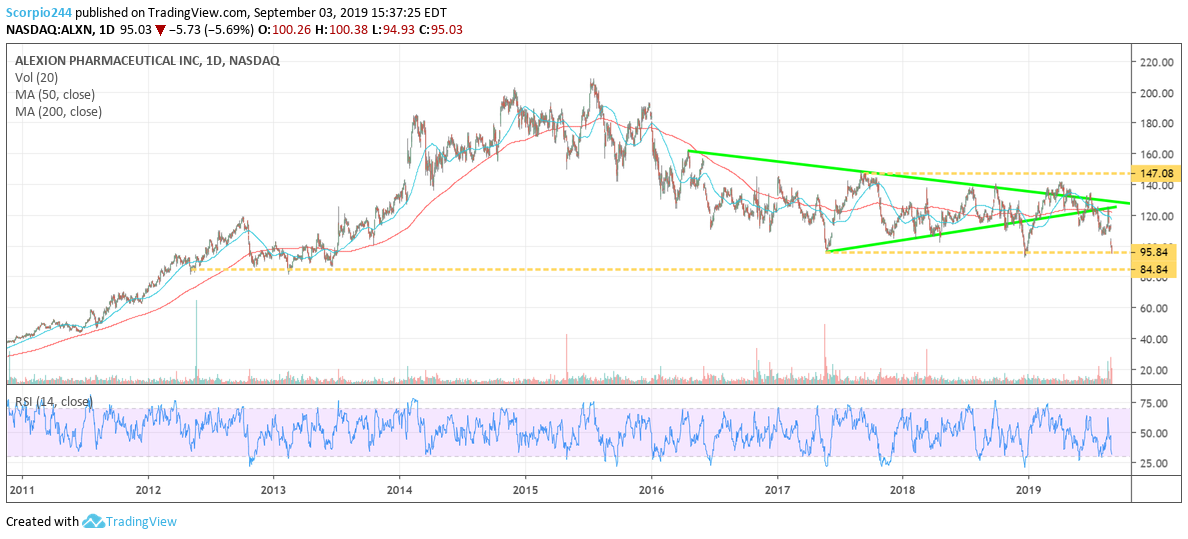
Alexion (NASDAQ:ALXN) is at a do or die moment, with the potential for shares to fall to roughly $85.
