New Chief Monetary Bureaucrat Goes from Good to Bad for Silver
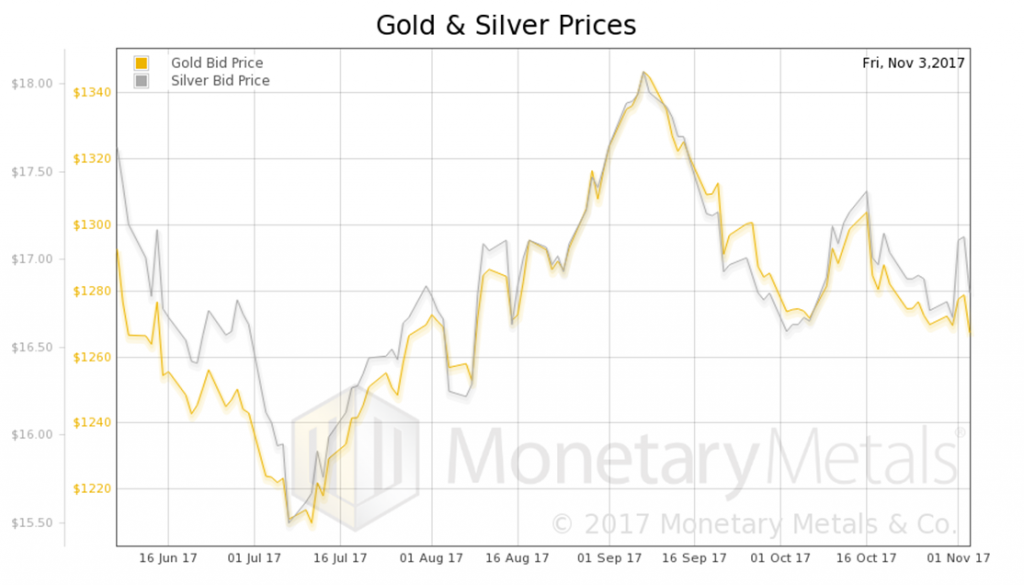
The prices of the metals ended all but unchanged last week, though they hit spike highs on Thursday. Particularly silver his $17.24 before falling back 43 cents, to close at $16.82.
Never drop silver carelessly, since it might land on your toes. If you are at loggerheads with gravity for some reason, only try to handle smaller-sized bars than the ones depicted above. The snapshot to the right shows the governor of Nevada before the bar dropped (based on his sanguine facial expression).
It was not a gentle fall back. In about an hour and fifteen minutes on Friday morning (as we Arizonans reckon the time), the price of silver dropped from $17.16 to $16.76. Was this a case of the infamous manipulation we’ve all read about? We can’t tell you who did it, but we can show you a clear picture of what happened.
In any case, it seems that either Fed chairman appointee Powell is not good for silver, or else that the price of silver has little to do with continuation of current Fed (central) planning.
Wall Street dispenses appointment advice to Field Marshall Trump, in an effort to prevent any disturbances in the business-as-usual force. The danger is de minimis anyway, given the nature of central planning… but you never know. So far, so good – the recently anointed Mr. Powell reportedly doesn’t want the Fed to be too hasty with its “policy normalization” adventure. [PT]
Fundamental Developments
We will look at intraday gold and silver supply and demand fundamentals. But first, here are the charts of the prices of gold and silver, and the gold-silver ratio.

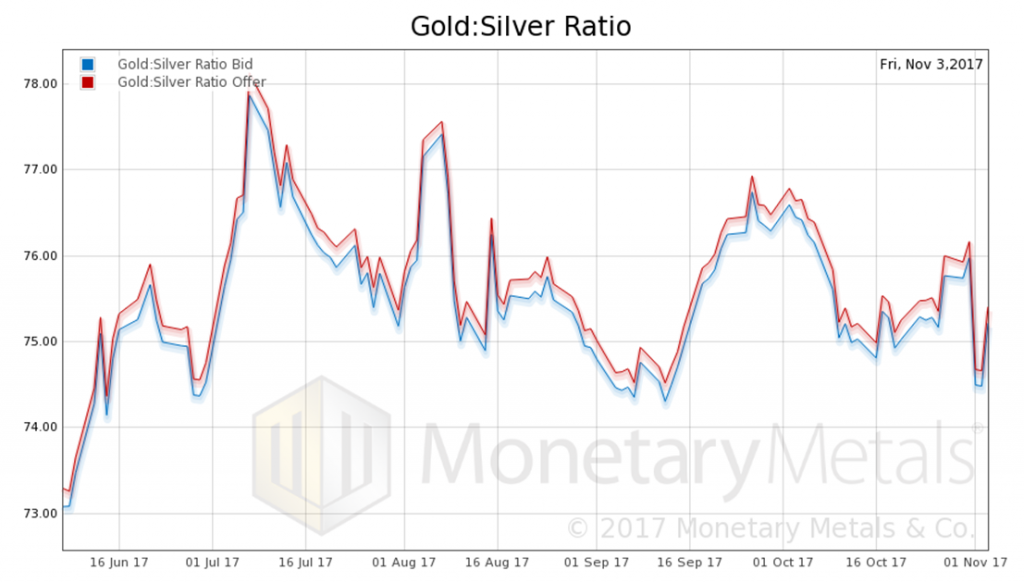
Next, this is a graph of the gold price measured in silver, otherwise known as the gold to silver ratio. The ratio fell a hair.
In this graph, we show both bid and offer prices for the gold-silver ratio. If you were to sell gold on the bid and buy silver at the ask, that is the lower bid price. Conversely, if you sold silver on the bid and bought gold at the offer, that is the higher offer price.

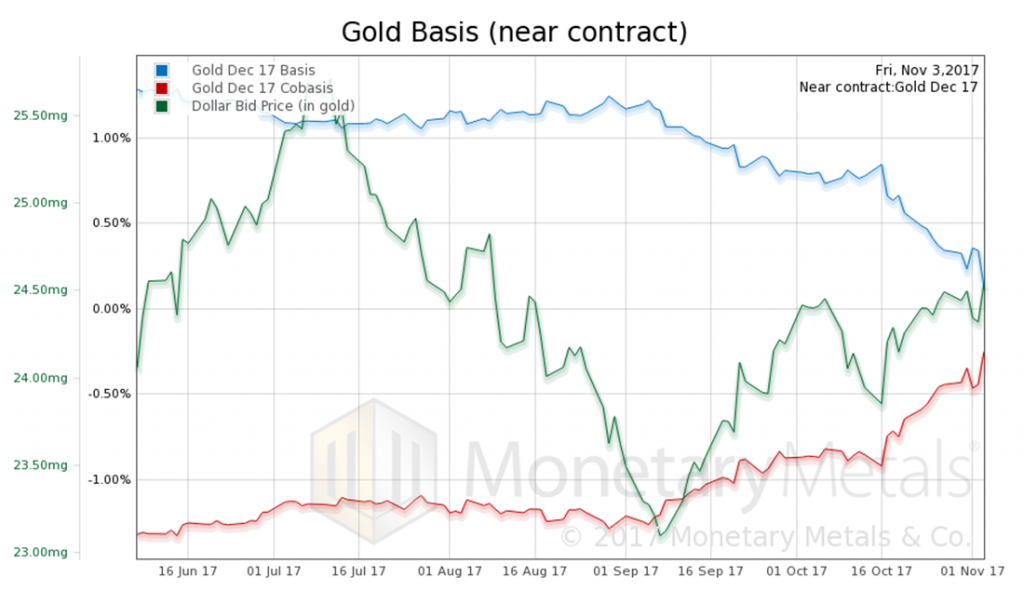
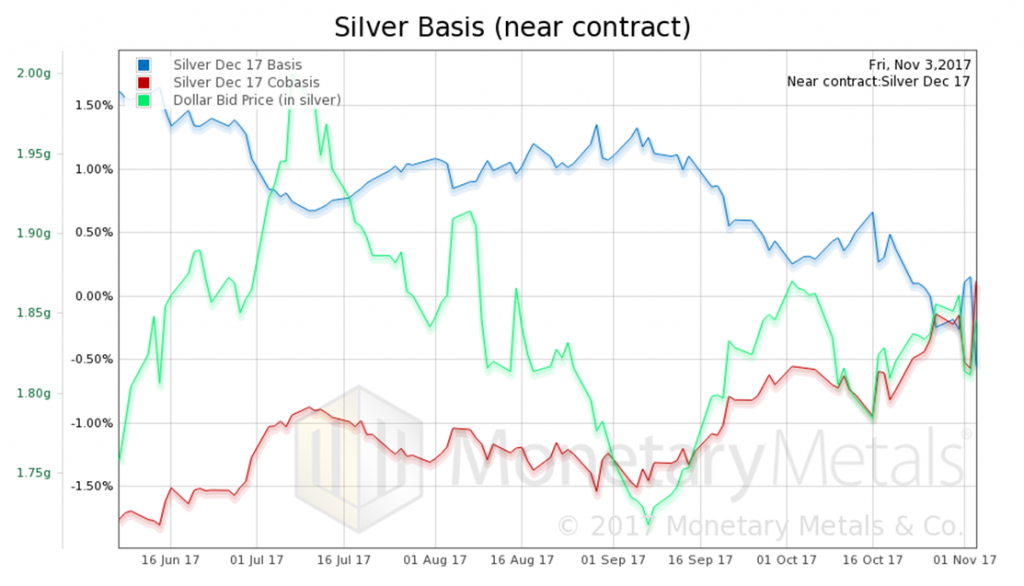
For each metal, we will look at a graph of the basis and co-basis overlaid with the price of the dollar in terms of the respective metal. It will make it easier to provide brief commentary. The dollar will be represented in green, the basis in blue and co-basis in red.
Here is the gold graph showing gold basis and co-basis with the price of the dollar in gold terms.

Gold basis, co-basis and the US dollar priced in milligrams of gold.
We see a rising co-basis (our measure of scarcity) along with a rising price of the dollar (i.e., a falling price of gold, in dollar terms). This is not surprising; it is the typical pattern nowadays.
Our calculated Monetary Metals gold fundamental price moved down by $12.
Now let’s look at silver.

Silver basis and co-basis and the US dollar priced in grams of silver – click to enlarge.
We also see the co-basis tracking the price of the dollar. Look at how they go down together on Wednesday and Thursday, and up together on Friday. Keep in mind that the contract roll is well underway, that it impacts the silver basis more than the gold basis. Mechanically, the roll involves selling the expiring contract.
Our calculated Monetary Metals silver fundamental price rose $0.22.
Now, on to Friday’s crash. This is the opposite situation from a week ago, when gold and silver got Powelled. In more ways than one.
In Part II of this article, we show intraday graphs of both metals for Wedneday’s price spike and Friday’s price crash, and provide our analysis of the basis moves.
