
One of the focuses of the trade war with China has been U.S. commodities, with the largest impact being felt by crop farms. Ag commodities have been an interesting corner of the market because there’s a growing list of impacts on both sides of the trade. On one side, we have declining demand for crops as China levies a 25% tariff on several U.S. crops and a bumper crop supply from years past. But on the flip-side of the commodity coin is the weakening outlook for the supply in this year’s crop and the bullish positioning in the futures market.
The latest USDA crop report showed the trend in planting of corn has been one of the lowest in nearly a decade. Karen Braun of Reuters shared the chart below, noting that U.S. planting progress for corn is at just 49% compared to the five year average of 80% by this time of the year. Soybeans are also not getting planted like many farmers would like, their progress Braun reports, is at 19% vs. 47% on average.
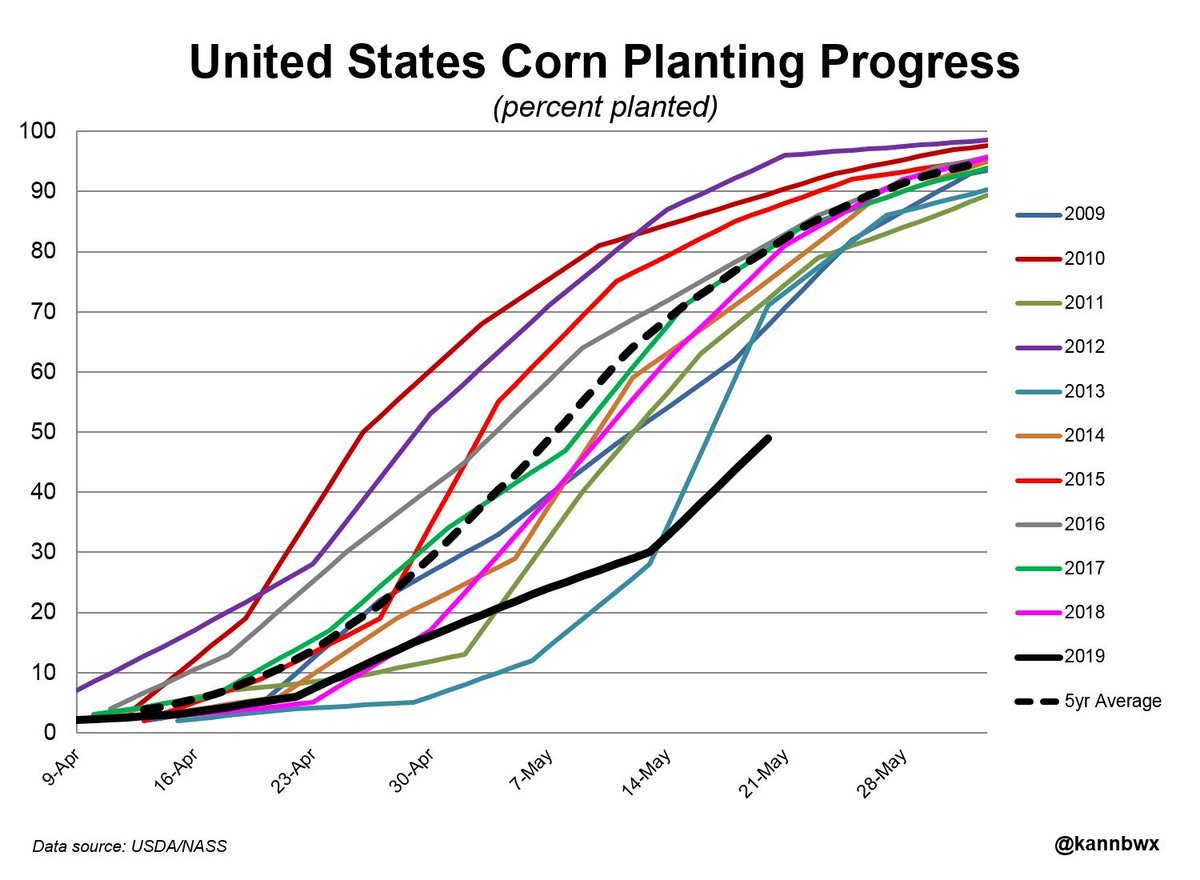
The price of many crops have been pushed lower on the belief that the tariff war will weaken demand and the prior year’s bumper crop will soften any lack of supply out of this year production. But the weather impact on crops has been worse than what many analysts may have initially expected at the start of the year.
The charts that have my strongest interest are those of the Commitment of Traders (COT) for Corn and the daily chart of the commodity itself, so let’s dive into those…
First up is the corn futures chart. Corn has been in a sideways trading range since June 2018. The most recent move lower since January saw prices of the crop produce an intraday test of the September ’18 low, which also brought with it a bullish momentum divergence as the RSI indicator made a higher low while price put in a lower low. Last week corn rallied by 9% and Monday’s price action created the push it needed to break out to a multi-month high, breaking prior resistance set in August and December of last year.
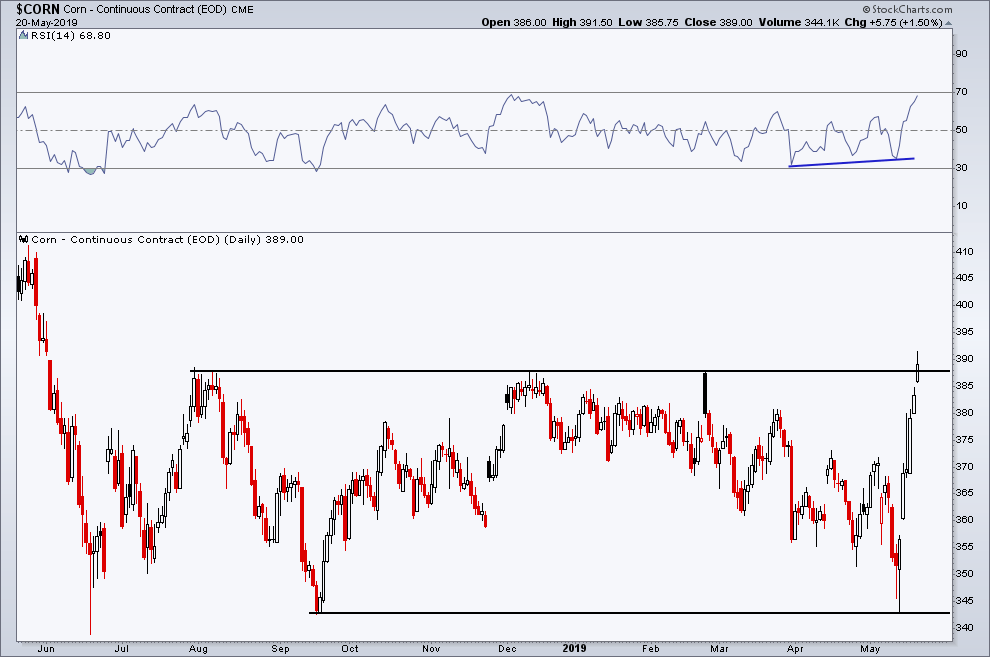
With that we know that the price action has begun to look more constructive from a bullish viewpoint. Next let’s see how traders are actually positioned in this market with the Commitment of Traders report.
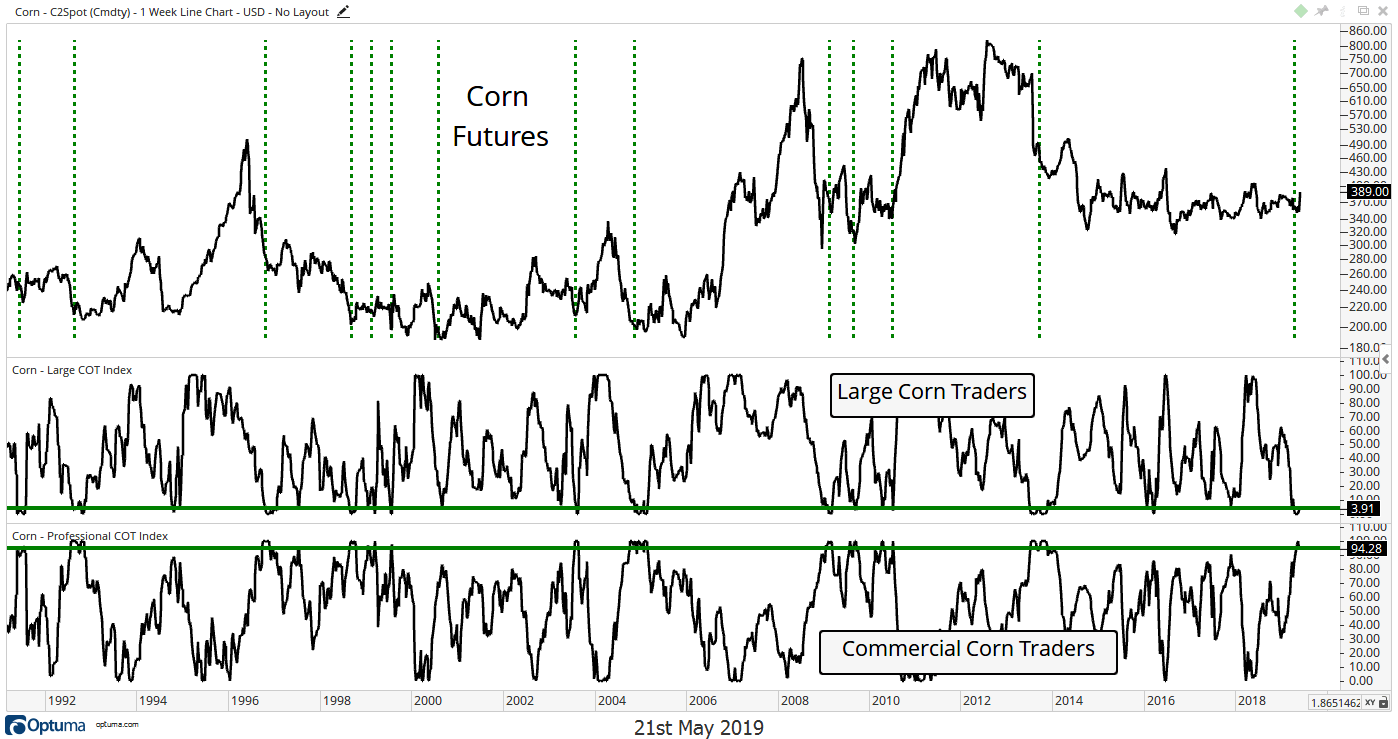
Below is a weekly chart of corn and the net position data for Large and Commercial Traders, built into respective indicators comparing their current levels to a historical look-back period. By viewing the COT data this way we can get a better idea if the current positioning is at a historical extreme relative to what each trading group typically holds within the futures market. Right now Large Traders are holding a very large (compared to history) net-short position in corn while Commercial Traders (those who actually use the commodities and likely have a much better insight into the market) have moved well into a net-long bias. (side note: There’s a third group, retail traders, which I’m leaving out of the discussion.) This chart goes back to 1992 and there’s only been roughly 13 prior instances where both trading groups were holding such extreme positions. Typically Commercial Traders are net-short, using the futures market as a hedging tool to mitigate the commodities risk to their business which is already sensitive to the price of the commodity. So when they unwind that hedge and actually take on additional pricing risk, that’s a bullish sign in my view.
With that, we have a bullish breakout in price accompanied by a bullish divergence in momentum, a crop report showing a weakening in supply. A prior bearish outlook on ag commodities due to tariff discussions, which themselves sets up for a bullish outcome if the trade war is ended and the tariff on crops by China is taken away. Finally, we have a bullish positioning based on COT data by the end-user of the commodity. The same type of setups can also be found in several other crop charts as well.
Full disclosure: Through exposure with ETFs, my firm has a position in client accounts associated with crop commodities.
Disclaimer: Do not construe anything written in this post or this blog in its entirety as a recommendation, research, or an offer to buy or sell any securities. Everything in this post is meant for educational and entertainment purposes only. I or my affiliates may hold positions in securities mentioned in the blog. Please see my Disclosure page for full disclaimer.