As headlines flickered across a Bloomberg news feed this morning, I was struck by the plethora of slanted views. If it was anymore slanted it’d be vertical. A mishmash of sound bytes sans fact. I was reminded of days spent imbibing on university economics. It’s no wonder university students drink so much…
Looking around for poorly thought out economic analysis we’re spoiled for choice.
Journalists opining when they themselves typically have no skin in the game which they’re opining on.
Professors postulating theories which bear resemblance to the real world in the same way an iPhone bears a resemble to a hippopotamus.
Theories treated as “pearls of wisdom” which these professors haven’t the balls to test in the real world themselves, but have no qualms depositing, like pigeon droppings, on unsuspecting gullible college kids looking to the gods for wisdom.
Money hacks selling their book, and TV anchors grinning for the cameras and interrupting in the event anything reasonably intelligent is divulged by their guests.
Pass the rum already! Is it any wonder the masses keep getting burned?
What is the solution then, Chris?
I don’t know. I’m a humble guy navigating the same environment you are. Perhaps you can help? Left to me, I figure we ought to shut down many of these establishments, torch them possibly, collect the insurance payouts, and use those college funds to send adolescents out into the world to learn about what matters.
As for TV media, I’d like to have a pop up that appears on the screen showing who has been compensated and in what fashion whenever messages are made. This would make things so much easier to understand. Bias and agenda on show for all to see. Can someone build an app for that?
Since none of the above is going to happen, except maybe the app, instead I’ll share with you a sampling of our framework and what we’ve got on our radar.
Right or wrong, our investing is driven by building a framework which is centred on global capital flows. Where capital moves to, why and for how long those particular trends last is the starting point. With that in mind, I thought that I’d share with you some of my starting points.
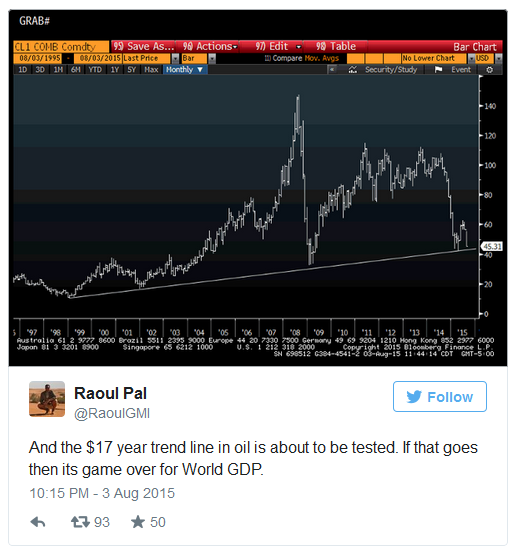
Deflationary forces at work. Need I say more?
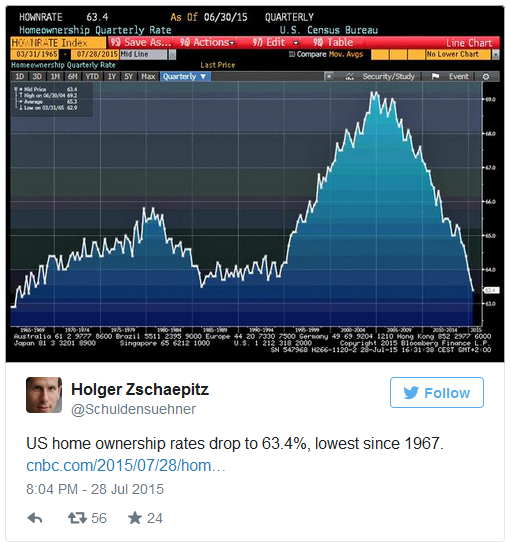
The concept of owning a home bought and paid for over a 30 year amortization may not be tenable, certainly when one considers the leverage attached to real estate and the fact that interest rates are at historical lows. Risk reward is simply not adding up. Is this the sign of sanity coming to a neighborhood near you?
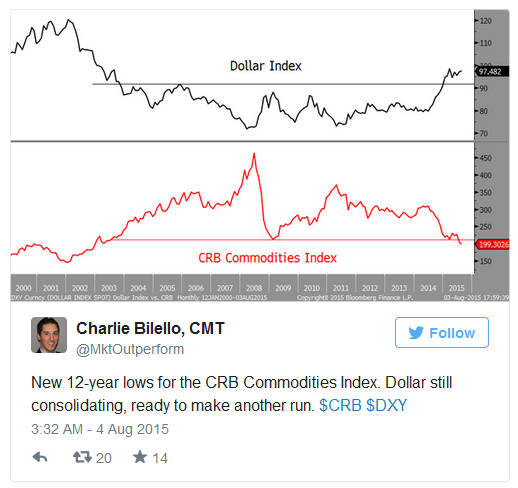
Strong dollar. Deflation. Commodity currencies still not felt the full extent of pain. Think of all the capex that has been invested and borrowed in – you guessed it – greenbacks. The $9+ trillion carry trade unwind!
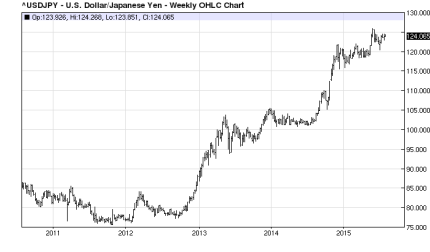
Dollar/yen: no surprises here. More to come. They have their own special brand of crazy, something we’ve spoken about at length.
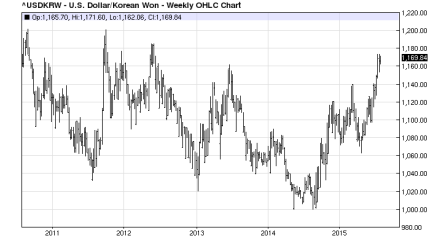
Korean won against the dollar. Overvalued relative to competitive export markets?
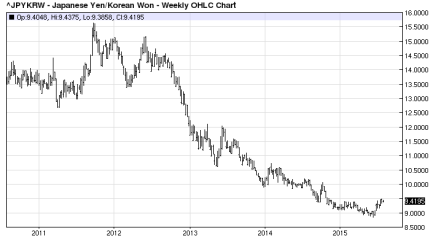
Now, the yen versus the won. This is hurting the Koreans. How long does this last before the Koreans succumb to the easy love potion of devaluation?
What Does All This Add Up To?
The dollar bull market we’ve been talking about here, here, and here, to list just a few.
Moving right along from the dollar bull market…
The movement of capital from public markets to private is a trend which we believe will only accelerate. The reasons for this are worthy of an article on its own and therefore something I’ll cover over the coming weeks.
For now, Andreessen Horowitz provide some eye candy showing what I’m talking about.
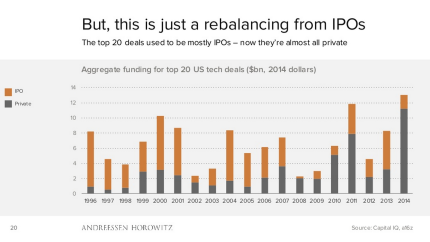
Capital is moving rapidly into private not public. Why go public is a question I’ve often asked.
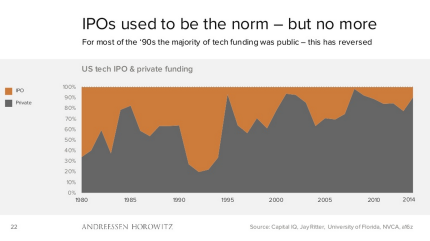
More of the same. We’ll be seeing more and more of the institutions which are playing in the IPO market becoming quasi VCs.
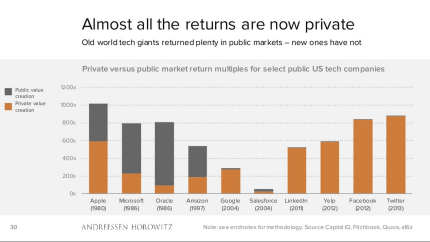
Who moved my cheese? If you want the big returns they’re not to be found where they used to be.
This promises to get interesting. Together with the JOBS Act allowing non-accredited investors the ability to participate in private deals, expect a flood of “professionals” who realize that why yes of course they’re actually venture capitalists, lack of knowledge be damned. It’ll be an absolute feast for penny stock promoters who will turn into private deal promoters. Look out for them, they’re coming to an inbox near you.
Sorry, no charts showing newly minted “professional” angel investors and venture capitalists. We may need to wait a few months. They’ll arrive as sure as flies are attracted to feces.
