Get 40% Off
🚨 Volatile Markets? Find Hidden Gems for Serious Outperformance
Find Stocks Now

8 Monster Stock Market Predictions For The Week Of November 25

Published 11/25/2019, 04:05 AM
Updated 09/20/2023, 06:34 AM

S&P 500 (SPY)

The S&P 500 has been rising in a channel since the beginning of November, and as of now, the channel has remained very strong. As long as the trend remains, the index is likely to continue to advance with 3,150 acting as the next level of resistance.
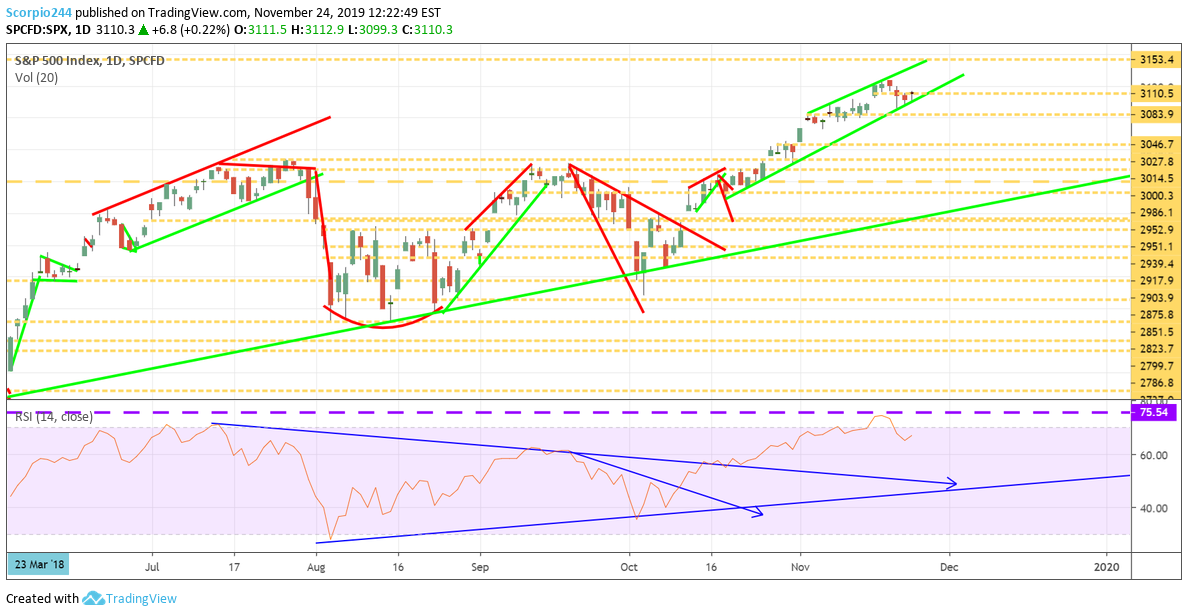
S&P 500 Index

Apple (AAPL)

Apple (NASDAQ:AAPL) has been rising as well. However, Apple may be showing signs of fatigue as the stock test support at $260. Should the level of support at $260 fail, it could be headed lower to $255.
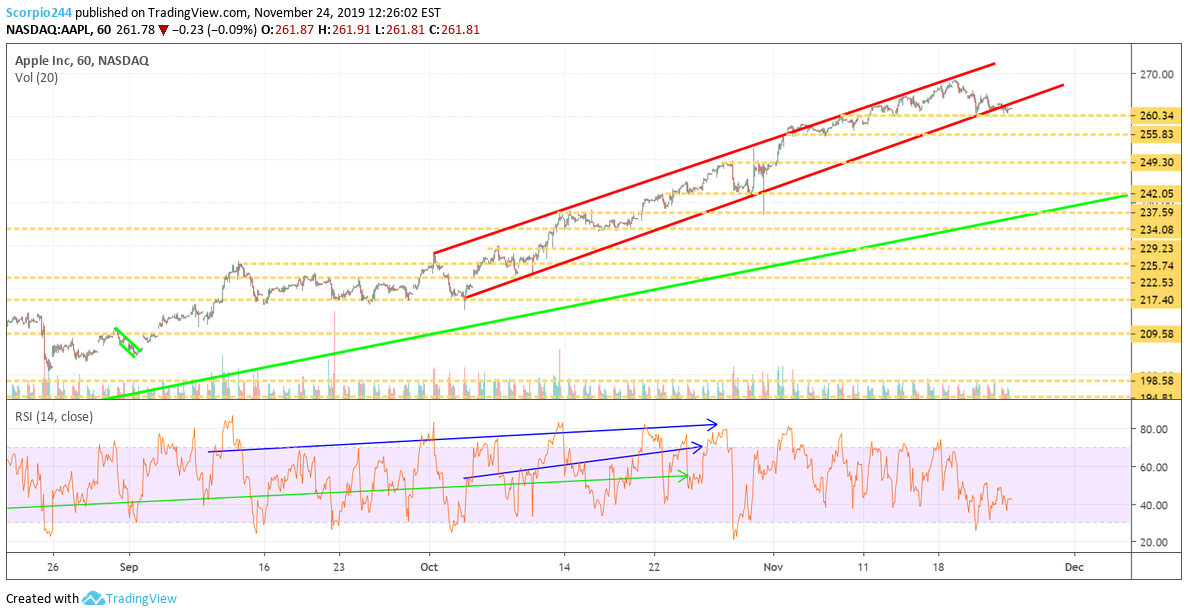
Apple Inc Chart

Microsoft (MSFT)

Microsoft (NASDAQ:MSFT) continues to move higher and is likely to test resistance around $152.
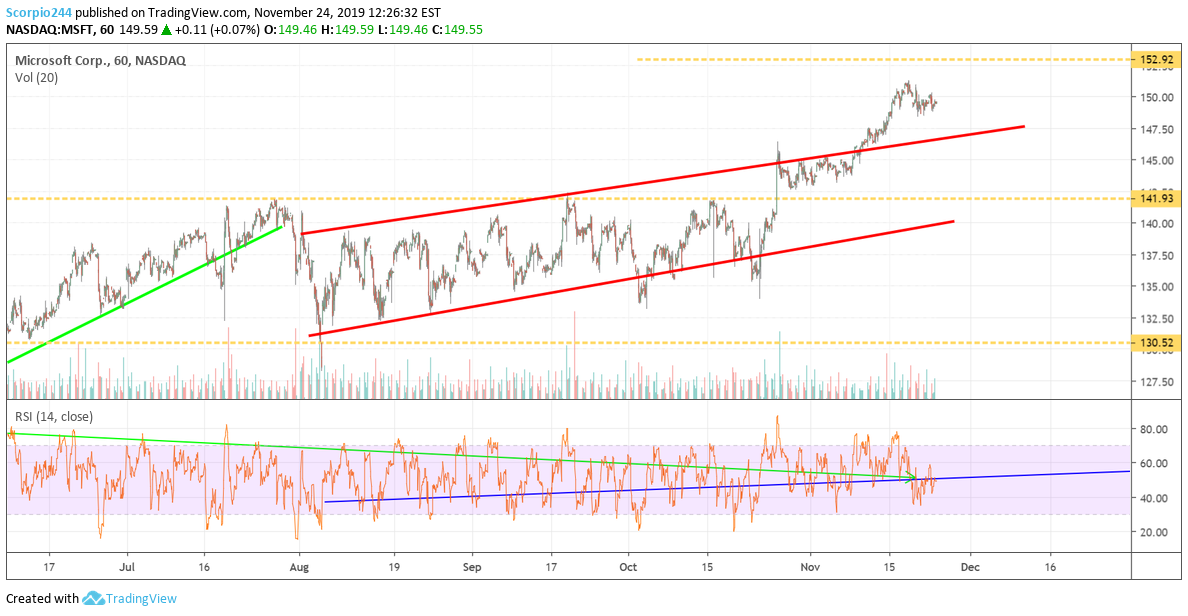
MSFT Chart

Tesla (TSLA)

There is a good chance that Tesla (NASDAQ:TSLA) bounces sharply and fills the gap back to $360 after the company announced it had almost 150,000 reservations for its cybertruck. Of course, a reservation is just $100, and it makes the hurdle much lower than what we have seen for the X and Y. But still, that is far more than people were opining on Friday, from what I heard.
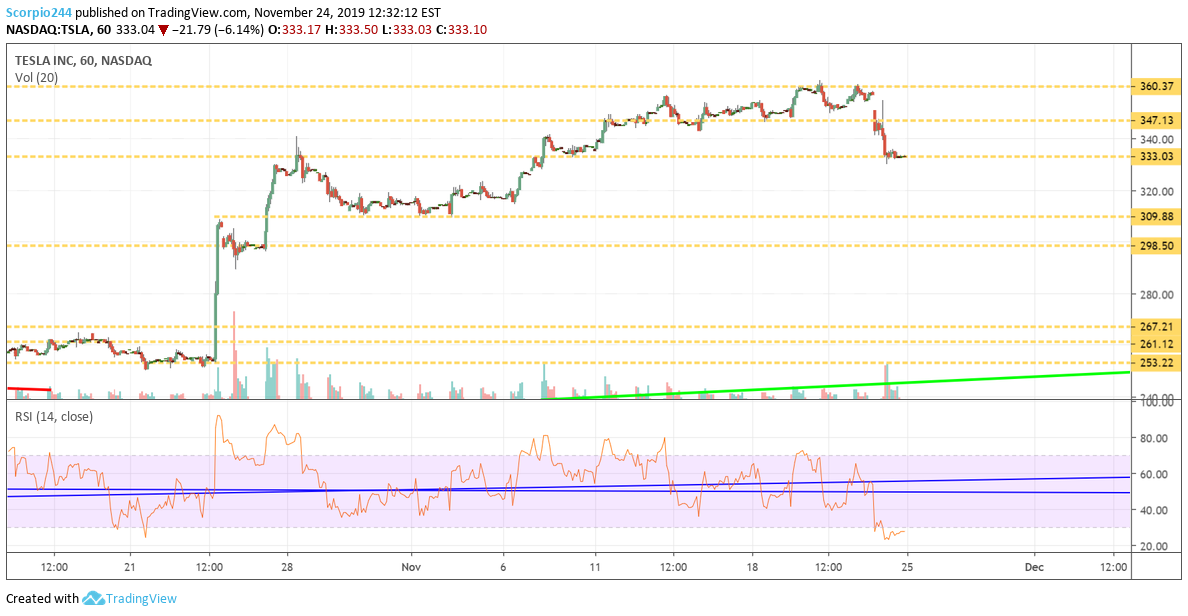
Tesla Inc Chart

General Electric (GE)

General Electric (NYSE:GE) looks like it may be forming a pennant pattern, and that means it may be heading to $12.35.
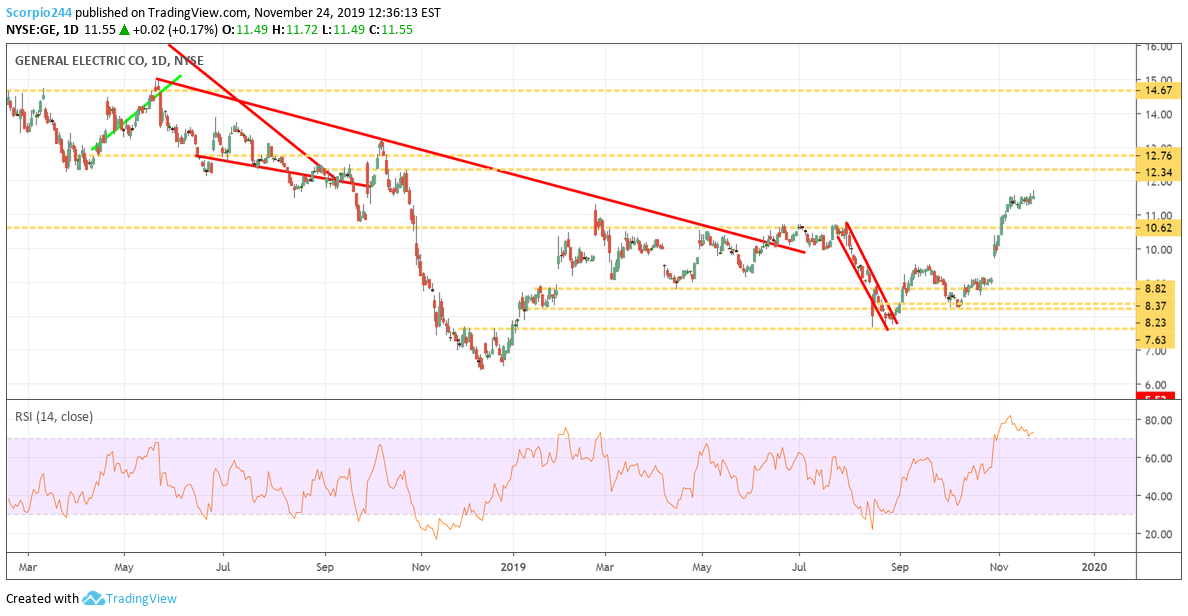
GE Co Daily Chart

ACADIA (ACAD)

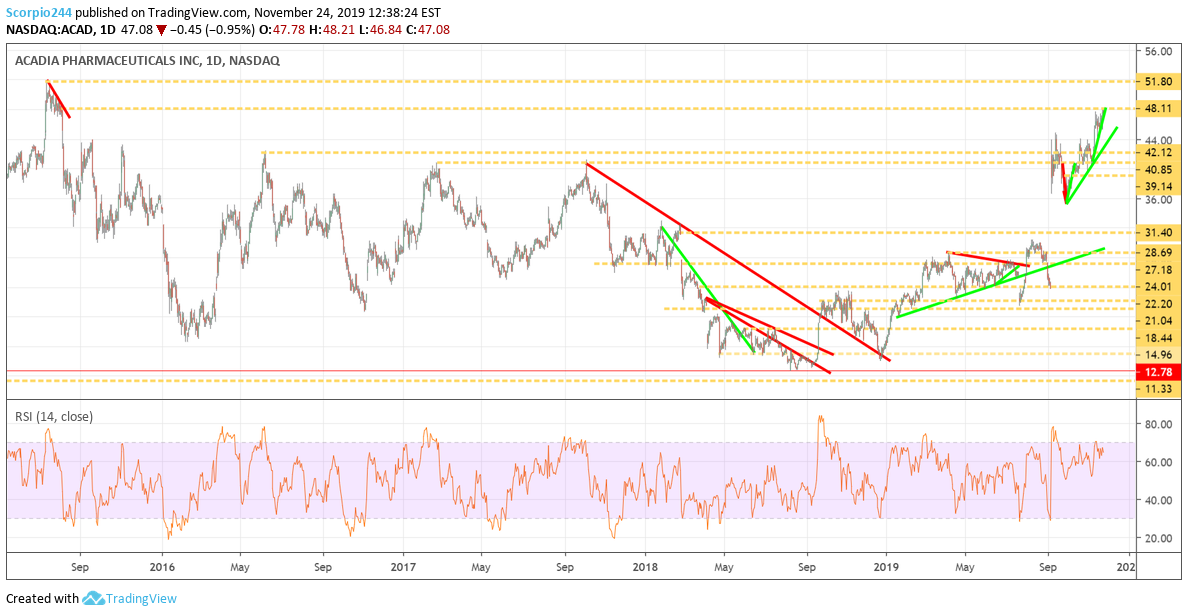
ACADIA Pharmaceuticals (NASDAQ:ACAD) has been challenging resistance around $48.25, and it appears to be forming a bullish rising triangle pattern. A break out sends the stock to $51.80.
3rd party Ad. Not an offer or recommendation by Investing.com. See disclosure here or remove ads .
Acadia Pharma Inc Daily Chart

Regeneron (REGN)

Regeneron (NASDAQ:REGN) is popping its head up, rising above resistance at $350. It could set up a push to $395.
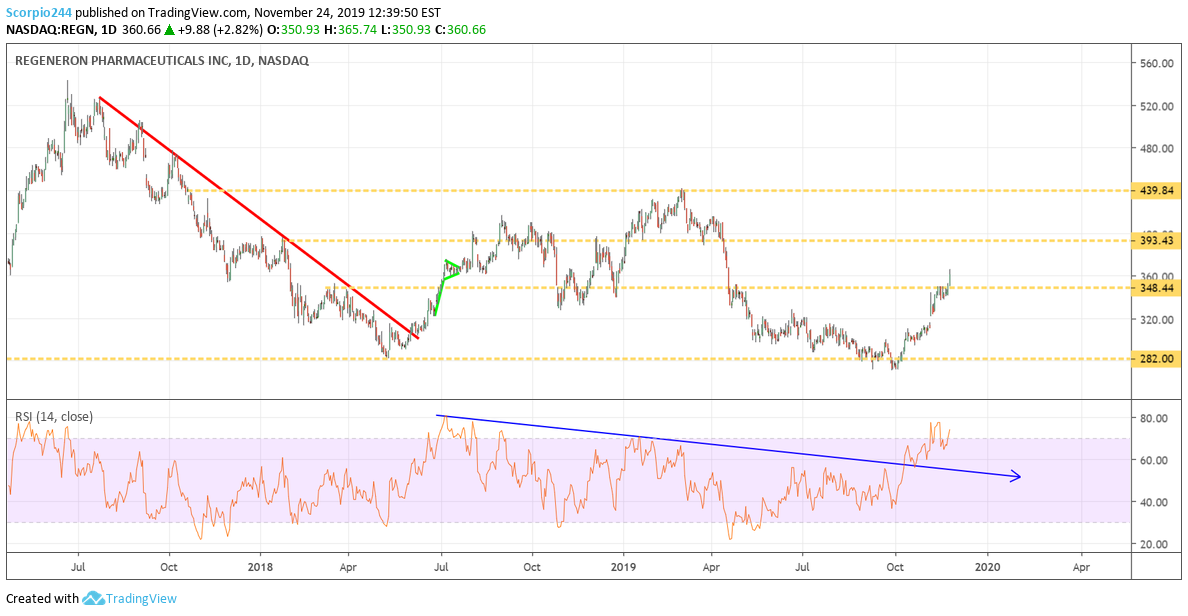
Regeneron Inc Daily Chart

Illumina (ILMN)

Illumina (NASDAQ:ILMN) is nearing a breakout at $316 that could result in the stock filling a gap up to $360.
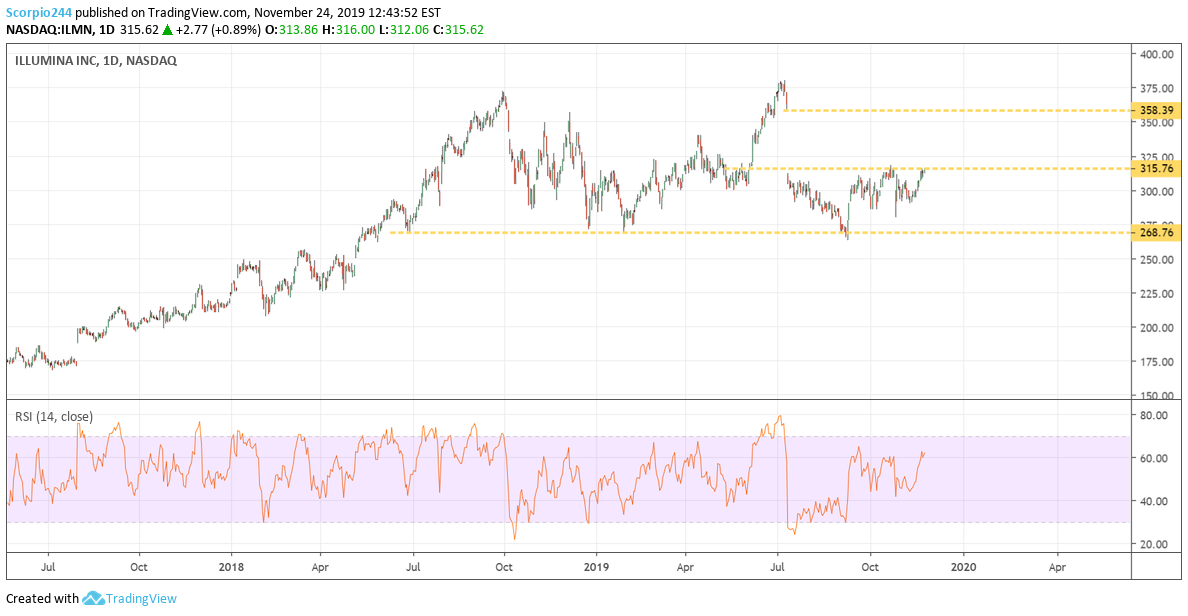
Illumina Inc Daily Chart

Original Post

Latest comments

thanks
Risk Disclosure: Trading in financial instruments and/or cryptocurrencies involves high risks including the risk of losing some, or all, of your investment amount, and may not be suitable for all investors. Prices of cryptocurrencies are extremely volatile and may be affected by external factors such as financial, regulatory or political events. Trading on margin increases the financial risks.
Before deciding to trade in financial instrument or cryptocurrencies you should be fully informed of the risks and costs associated with trading the financial markets, carefully consider your investment objectives, level of experience, and risk appetite, and seek professional advice where needed.
Fusion Media would like to remind you that the data contained in this website is not necessarily real-time nor accurate. The data and prices on the website are not necessarily provided by any market or exchange, but may be provided by market makers, and so prices may not be accurate and may differ from the actual price at any given market, meaning prices are indicative and not appropriate for trading purposes. Fusion Media and any provider of the data contained in this website will not accept liability for any loss or damage as a result of your trading, or your reliance on the information contained within this website.
It is prohibited to use, store, reproduce, display, modify, transmit or distribute the data contained in this website without the explicit prior written permission of Fusion Media and/or the data provider. All intellectual property rights are reserved by the providers and/or the exchange providing the data contained in this website.
Fusion Media may be compensated by the advertisers that appear on the website, based on your interaction with the advertisements or advertisers.
© 2007-2024 - Fusion Media Limited. All Rights Reserved.