
Hard Evidence Says Be Open To Bottoming Process
If you were willing to examine the investment landscape without bias, there were seven reasons to remain very open to a big rally in stocks, rather than a 2011-like plunge:
- Markets need hope, not a solution
- Yellen was a shoo-in
- Fear peaked at a logical level
- Investors cooled on bonds
- Defensive assets were not in great demand
- Cyclical assets were holding up well
- Buyers stepped in near logical S&P 500 support
2012 Taught Us To Look For Cooperation in D.C.
The fiscal cliff was a good primer for the political theater that has been revolving around the debt ceiling and government shutdown. It was mid-November 2012 and the S&P 500 had dropped 131 points as fears of the over-hyped fiscal cliff approached. Politicians were doing a lot of talking in front of the cameras, but little-to-no progress was being made to address the core issues (sound familiar?). The markets were looking for any ray of hope. They got it on Friday, November 19, 2012 when leaders from both parties stepped to the microphones together as a sign of good faith. The markets did see some volatility over the next six weeks, but a new low was never made. As the negotiations continue, volatility is probably here to stay for a time in 2013, but a low or bottoming process may be at hand. 
On October 9, we pointed out any good news on the 2013 “crisis” could bring buyers off the sidelines. They came out in full force Thursday.
A Break In The Standoff
Thursday’s monster rally in stocks was very similar to the “light at the end of the tunnel” rally that followed the November 19, 2012 joint press briefing. From Reuters:
Republicans in the House of Representatives offered a plan on Thursday that would postpone a possible U.S. default and urged President Barack Obama to negotiate an end to the 10-day government shutdown. The move signaled a new willingness by Republicans to break a standoff. The White House said it would consider the offer.
Yellen ETFs Aligned With Taper Later
When Larry Summers dropped out of the Fed race, it turned into a one-woman show starring Janet Yellen. The markets were confident with a high degree of certainty that the proactive-money-printing Yellen was going to get to sit in the big chair. On Wednesday evening, we posted an ETF table and hypothesized that a pro-QE/Yellen-induced risk-on scenario should benefit two broad areas in the investment universe: (1) emerging markets, and (2) foreign developed nations. We also noted that if those areas began to outperform the risk-off categories, bonds (AGG) and shorts (SH), then the case for a reversal in stocks would be strengthened. One day does not make a trend, but the updated table (right) shows our short list of ETFs from Wednesday not only aligned with risk-on, but also did quite well performance-wise. 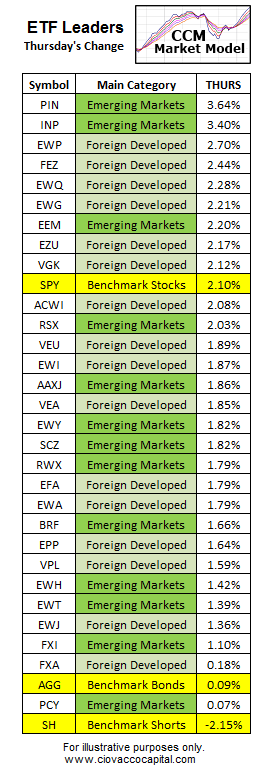
President Rejects Proposal, But Breakthrough Still Seen
Correction lows in stocks, especially those tied to a political process, tend to be more of a process than a V-shaped clean buying opportunity. After the big gains in equities Thursday, reports surfaced that remind us smooth sailing is not a term that will be used often in the next few weeks. From The New York Times:
President Obama on Thursday rejected a proposal from politically besieged House Republican leaders to extend the nation’s borrowing authority for six weeks because it would not also reopen the government. Yet both parties saw it as the first break in Republicans’ brinkmanship and a step toward a fiscal truce. Despite the president’s rejection, the House Republican offer represented a significant breakthrough. Representative Paul D. Ryan of Wisconsin, the chairman of the House Budget Committee, said Republicans were now willing to go to formal negotiations with Senate Democrats over a long-term, comprehensive budget framework, a move Republicans have resisted since April.
A Spike In Fear Set The Table For Stock Bulls
Without getting into the physics behind the VIX, all we really need to know is that it tends to zig when the stock market zags. Rapid spikes in the VIX often signal a peak in investor fear. The chart below looks noisy, but the concepts are easy to follow if we step through it using the labels. When the VIX peaked near A1, it coincided with a bottom in the stock market (see A2). The blue line has acted as resistance for fear on two other occasions that coincided with stock market buying opportunities (B1 and C1). The spike in investor fear Wednesday (point D) was very similar to point C1, where stocks subsequently rallied (C2). Will the pattern help mark a bottom this time? Only time will tell, but the current look of the chart below aligns with increased odds of a bottoming process. 
When Interest Rates Fall
Yield curves and negatively correlated relationships can sound confusing. All we really need to know is investors tend to prefer stocks over bonds when they are confident. When fear is increasing, demand for bonds drives down interest rates. The chart below shows interest rates on top with the S&P 500 below. When interest rates began to fall near A1, it signaled increased demand for safe haven bonds. When investors flock to safe havens, stocks tend to fall (see A2). The same pattern came into play when rates peaked near B1 and stocks subsequently dropped (B2). Falling rates means fear which is bad for stocks. Rates recently held above the green dotted line near point D, which signaled tepid demand for safe haven bonds. Tepid demand for safe haven bonds is the perfect setup for a rally in stocks, which is what occurred Thursday.
Institutions Were Not Positioned For Armageddon
On October 4, we made the case that defensive ETFs were telling us to be open to bullish outcomes. The analysis looked at the demand for defensive assets prior to the U.S. downgrade/2011 waterfall drop in stocks. The basic conclusion:
Many pension funds must remain fully invested. When they are concerned about the stock market, they cannot convert to cash, but they can move to defensive consumer staples stocks. As shown in the chart below, that is exactly what they did as they prepared for the possibility of a downgrade announcement related to U.S. debt. The chart shows the demand for consumer staples (XLP) relative to the demand for the broader stock market (SPY). Fear is evident in the 2011 chart. The same ratio looks much healthier in 2013. The demand for consumer staples has been getting weaker in recent months, which tells us to be open to bullish outcomes after the debt ceiling issue has been put to bed. 
Cyclicals Not Screaming “Imminent Recession”
Demand is related to many things in the investing world, including confidence in the economy, earnings, innovation, and corporate leadership. A separate October 4 analysis compared 2011 and 2013 from an offensive, rather than defensive, perspective. The basic takeaway is captured in the segment below:
Charts allow us to monitor the never-ending battle between bullish economic conviction and bearish economic conviction. Experienced traders know higher beta and more economically sensitive ETFs tend to outperform when bullish confidence is greater than bearish concerns… reflecting a bullish stock market. So where are we now?… Instead of avoiding higher beta and economically sensitive sectors, traders are favoring those assets over the broader market. The chart below does not discount the possibility of short-term volatility and weakness as politicians follow their “I am fighting for my constituents and want to get re-elected” script, but it does tell us to keep an open mind about bullish stock market outcomes once things calm down.
Simple Support and Resistance
One thing that is often lost when critiquing the value of analyzing stock charts (aka technical analysis) is the charts help us understand and monitor economic conditions and fundamental concepts. For example, the concepts of support and resistance monitor the perception of economic value of all market participants. Investors tend to buy when they perceive value (or near support) and they tend to sell when their assets reach what they believe is an overvalued level (or near resistance). We tweeted the chart below Wednesday noting the “importance of being open to all outcomes, including bullish outcomes.” 
Investment Implications – Are You Sleeping Well?
If you are tossing and turning at night hoping the market will bail you out or allow you to “catch up”, your allocation between risk assets and conservative assets is probably out of balance. Our market model is designed to keep us properly aligned with the market’s tolerance for risk. Why the market’s tolerance? Because the market sets asset prices.
During the recent pullback, the market model allowed us to keep positions in emerging markets (EEM), foreign stocks (EFA), technology (QQQ), and small caps (IWM). The model balanced this downside risk with a large cash position, but it never recommended bonds (AGG) or hedges (SH). The ETF short list from Wednesday told us to focus on emerging markets and foreign stocks in the event of a breakthrough in Washington. Consequently, we added to our emerging markets and foreign stock positions during Thursday’s session.
The game plan from here is simple. If the market’s tolerance for risk continues to show observable improvement, we will continue to scale back in with our cash. If the political process becomes dysfunctional again, we are happy to incrementally scale back toward a more conservative stance. The market will bring us to a prudent allocation if we are willing to monitor the battle between economic conviction and economic fear with an unbiased, flexible, and open mind.