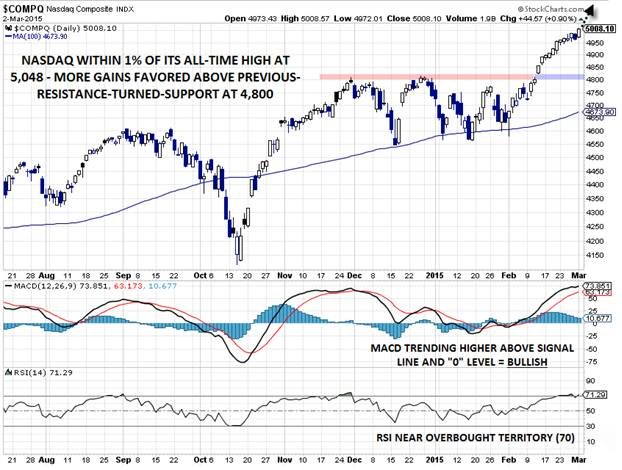
Midway through last month, we highlighted the bullish breakout in the NASDAQ index, concluding that the index, “is starting to look like it may have a date with its all-time highs at 5048 sooner rather than later. As long as the index holds above previous-resistance-turned-support at 4800, the path of least resistance will remain higher” (see “NASDAQ: Party Like it’s 1999!” for more). By now, most Americans have been bombarded with headlines announcing yesterday’s move back above the 5,000 level in the index, leaving the all-time high at 5048 less than 1% away.
In an interesting (some would say ominous) twist of fate, the NASDAQ’s last peak took place on March 10, 2000, almost exactly 15 years ago, and some analysts have argued that the return to the lofty levels of the tech bubble peak is a sign of an imminent top, but the fundamental factors driving the index are far more reasonable this time around:
1) Lack of compelling alternatives: The U.S. 10-Year yield is at just 2%, as compared to 6.2% when the NASDAQ last hit 5000 back in 2000.
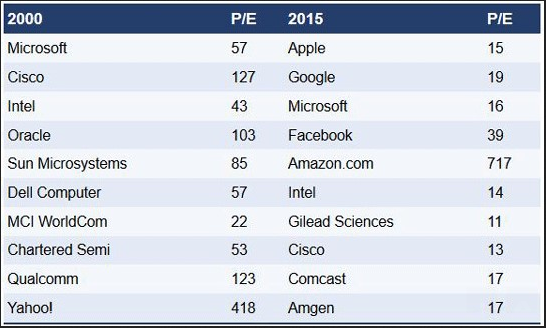
2) More reasonable valuation: The dearth of compelling alternative investments suggests stocks should be trading at a higher valuation, but the NASDAQ composite is trading at a more reasonable P/E multiple of 31 this time around, versus the preposterous 500 P/E ratio in 2000. The table below shows a “Then and Now” comparison of the P/E ratios of the top 10 stocks in the NASDAQ; with the exception of Amazon (NASDAQ:AMZN), investors are getting far more bang for their buck this time around:

Source: Barron’s Magazine
3) Greater sector diversification: The NASDAQ is ubiquitously described as “tech-heavy,” but the index’s tech weighting has actually mellowed substantially over the last 15 years. Technology stocks now represent just 43% of the index, down from 65% in 2000, and the allocation to typically-conservative health care stocks has risen from 7% to 16%.
4) 5,048 is just a nominal high: While the 5,000 level is a psychologically-significant hurdle for the market, there has been plenty of inflation in the last 15 years. To reach a new inflation-adjusted (“real”) peak, the NASDAQ would have to rise nearly 40% from here to 6,900.
5) Lack of excessive bullish sentiment: Perhaps most importantly, sentiment is not nearly as frothy as it was back at the peak of the tech bubble. Instead of people quitting their stable jobs to become full-time day traders, the general public remains skeptical of the stock market’s rally, despite massive gains over the last six years. This anecdotal view is supported by the number of new IPOs, which fell from 371 in 1999 to just over 50 last year. Until the public grows euphoric, the chances of a major long-term top are minimal.
While a near-term correction in the NASDAQ is always a possibility, the five fundamental factors noted above suggest that there’s a low probability of a major top forming at this point. From a shorter-term technical basis, the bias in the index will remain higher above previous-resistance-turned-support at 4800, and a breakout to a new all-time high at 5048 could add more fuel to the bullish fire.

Source: FOREX.com
For more intraday analysis and market updates, follow us on twitter (@MWellerFX and @FOREXcom)
