Summary
- Are global markets getting ahead of themselves?
- Suburban office parks are coming back.
- There were some key trend breaks on the 30-day charts.
Are the global markets signaling an economic rebound in 2020? Equity markets are forward indicators, which means most global indexes are predicting stronger growth in the next 3-6 months:
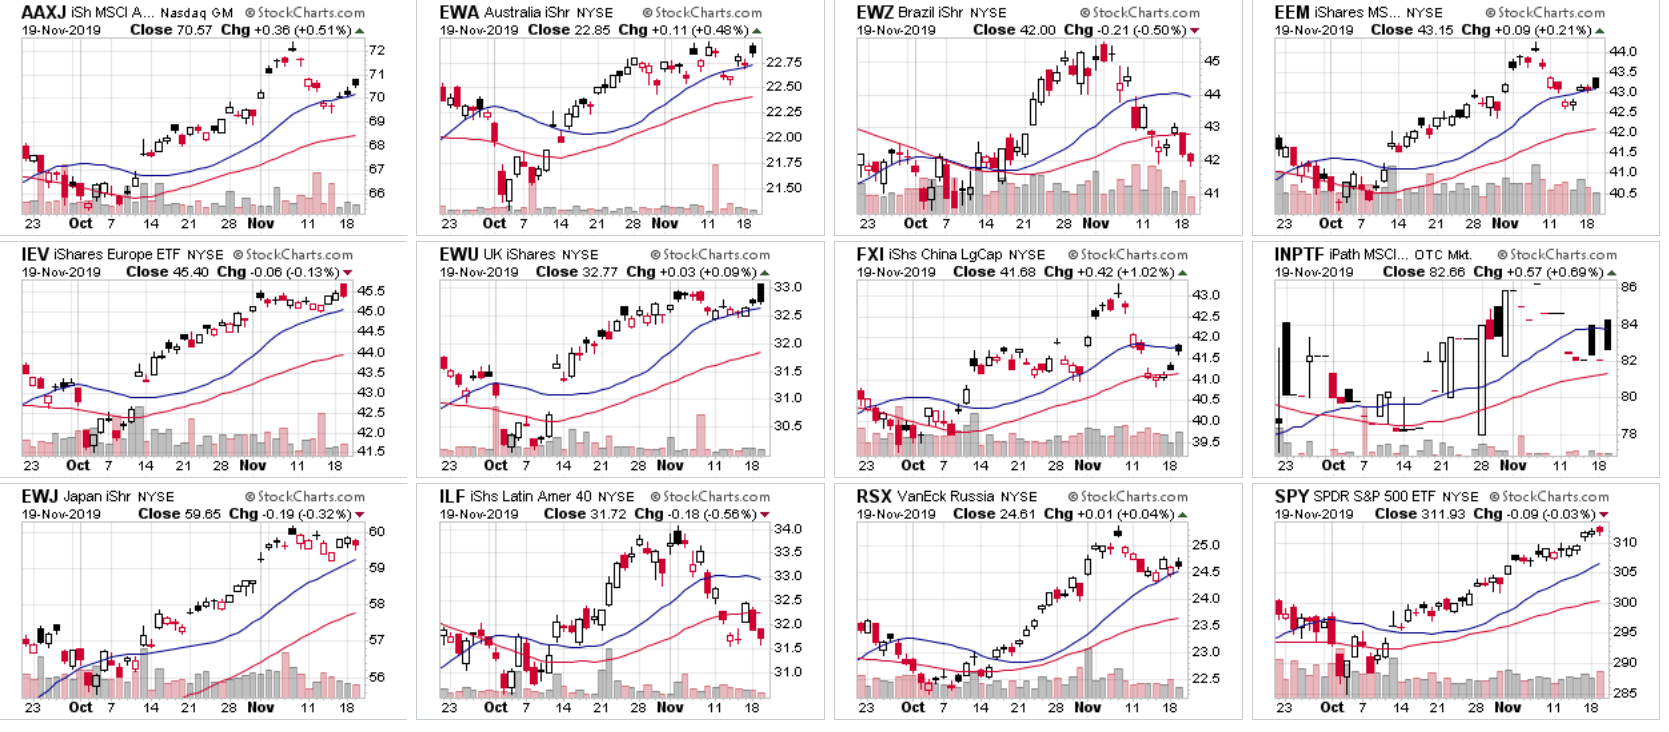
In the last two months, the following ETFs are up: All-Asia ex-Japan, Australia, Emerging Markets, Europe, the UK, Japan, Russia, and US. Underlying this bullishness is the belief that US-China trade tensions are lower and that Brexit will be resolved with little economic disruption. But there hasn't been a big change in the underlying data: China's numbers continue to grind lower, hurting broader Asia; Japan, the UK, and EU are barely growing (in fact, the European Commission has cut its forecast for the EU area); South America is experiencing weaker growth and heightened political issues. The best numbers are coming from the US, but 4Q19 growth is expected to be soft (the NY Fed's Nowcast is 0.39%; the Atlanta Fed's is 0.4%; the Blue Chip consensus' range is 1.5%-2.2%). A strong argument could be made that the markets are getting ahead of themselves.
Suburban office parks are making a comeback (emphasis added):
At the same time, today’s tight labor market means that real estate can play a significant role in attracting and retaining quality talent. In response, developers are upgrading many suburban office campuses and adding amenities to make them more appealing. These office parks are on their way to a comeback, some analysts say.
Here are the 1-year charts for the nine largest office space REITs by market valuation:
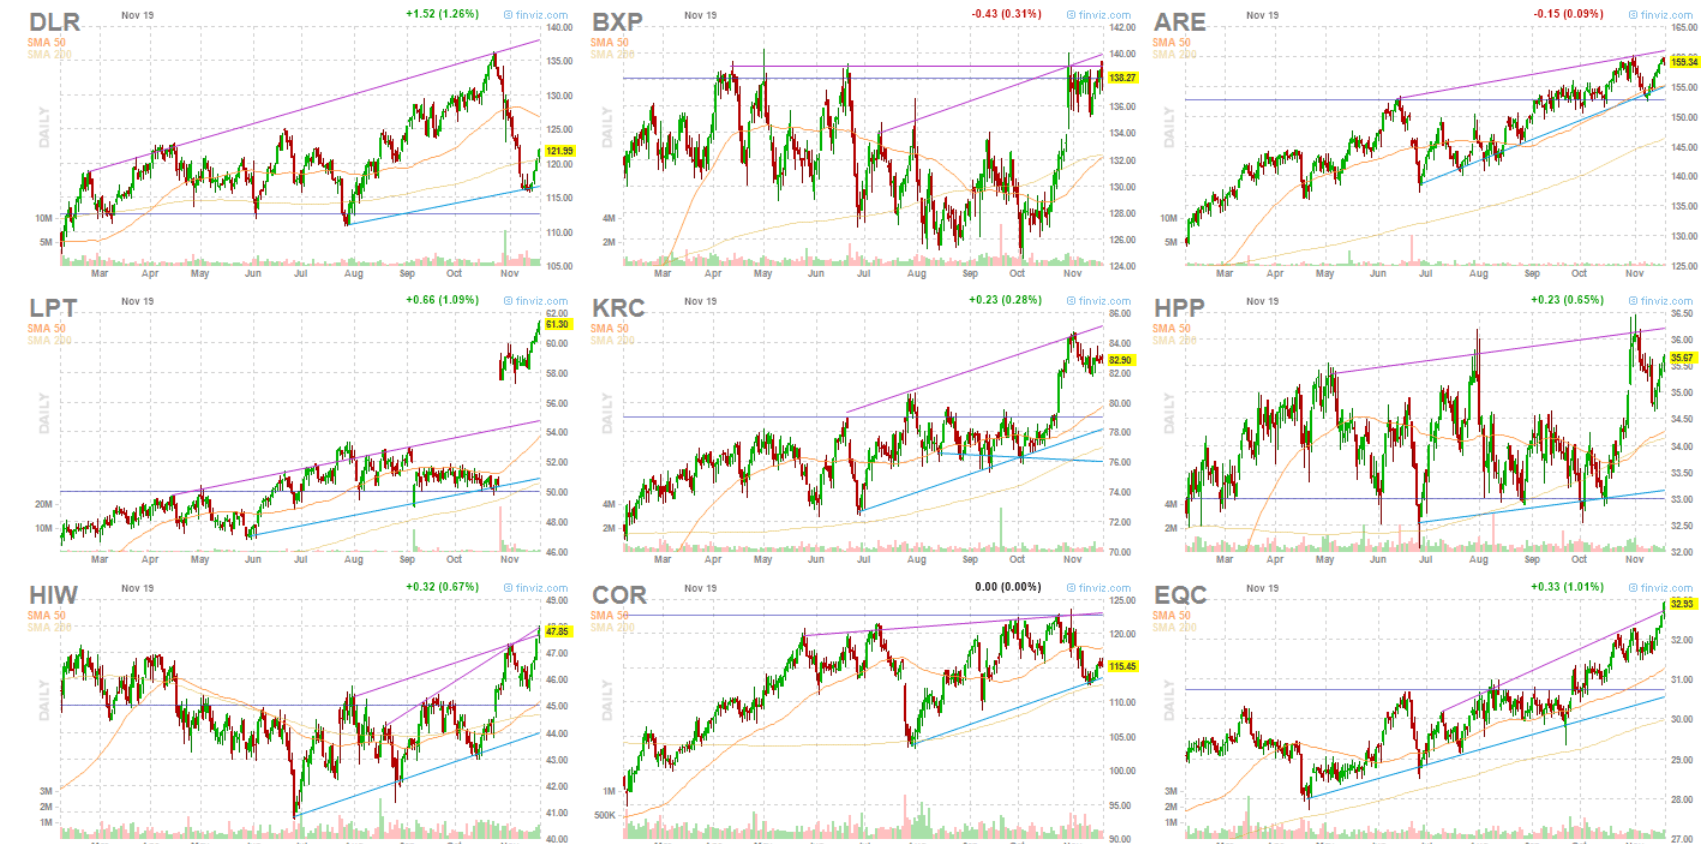
All except DLR (upper left) are at or near 1-year highs.
R-star is declining. R* is an unobserved hypothetical interest rate that's derived from observable phenomena. New York Fed President Williams (NYSE:WMB) recently noted that R* is declining globally (emphasis added):
... there’s just one point I want to make: r-star has fallen, not only in the U.S., but around the world.
Fundamental shifts have been occurring in the two main drivers of r-star over the past two decades: demographics and productivity growth. Lower fertility rates and aging populations, as well as slower productivity growth, have pushed down r-star by as much as two percentage points in a number of developed nations.
These structural shifts are having fundamental effects on real interest rates, growth, and inflation. A number of advanced economies have inflation below desired levels and longer-term interest rates that are well below where they were a decade ago.
From a policy perspective, this means we can expect low rates for the foreseeable future.
Let's look at today's performance tables:
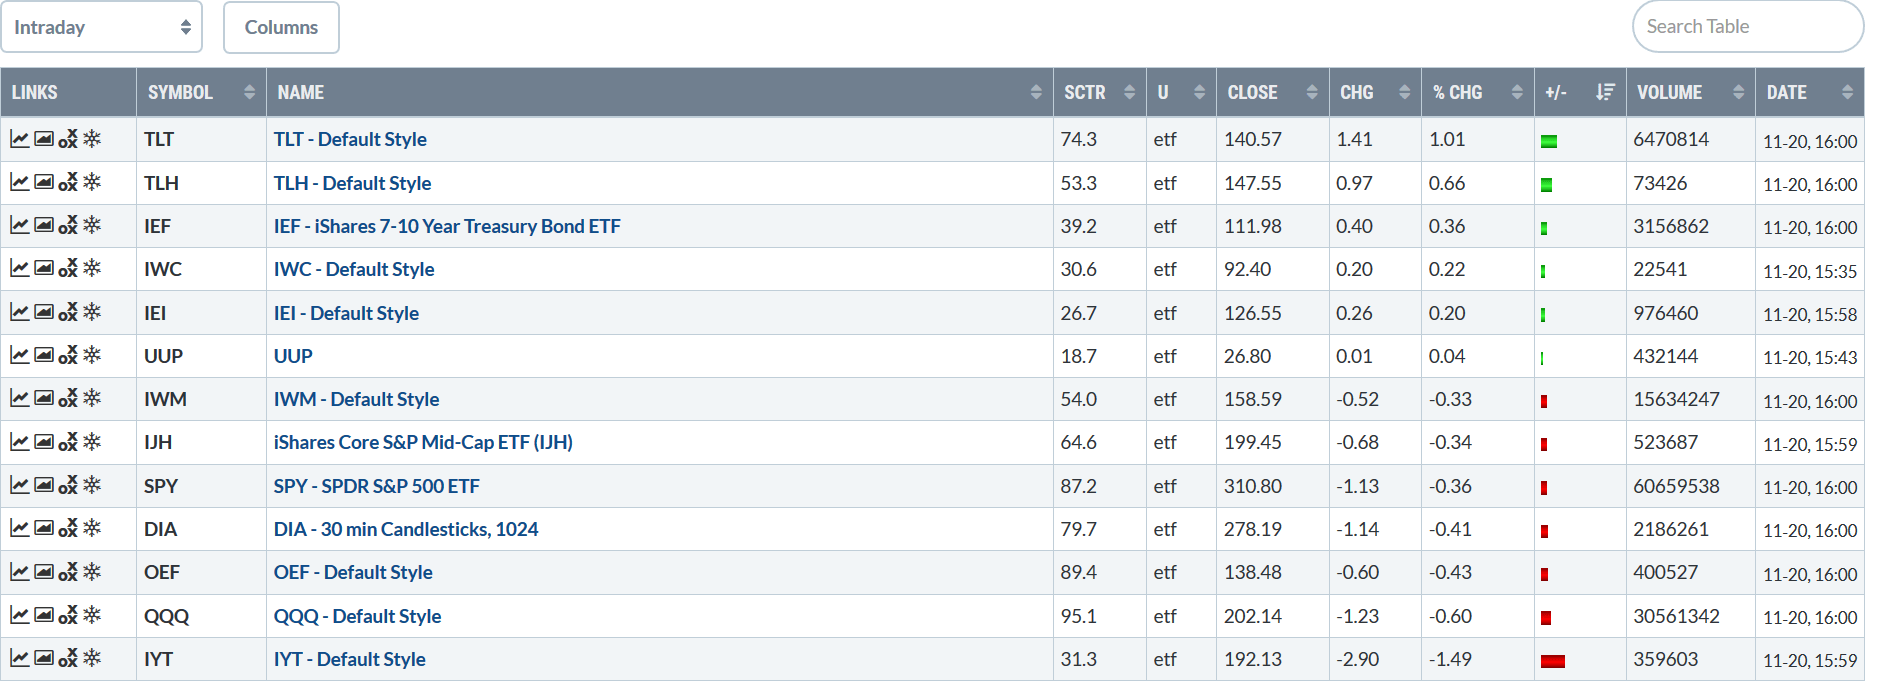
Treasuries led the markets higher with the long end and the belly of the curve leading the market higher. The only equity index that gained today was the IWC, which rose 0.22%. All the other equity indexes were lower.

Only three sectors rose: energy, utilities, and staples. Real estate occupied fourth place and was off modestly. That means defensive sectors occupied three of the top four spots. Basic materials were the worst performer, dropping 1.25%.
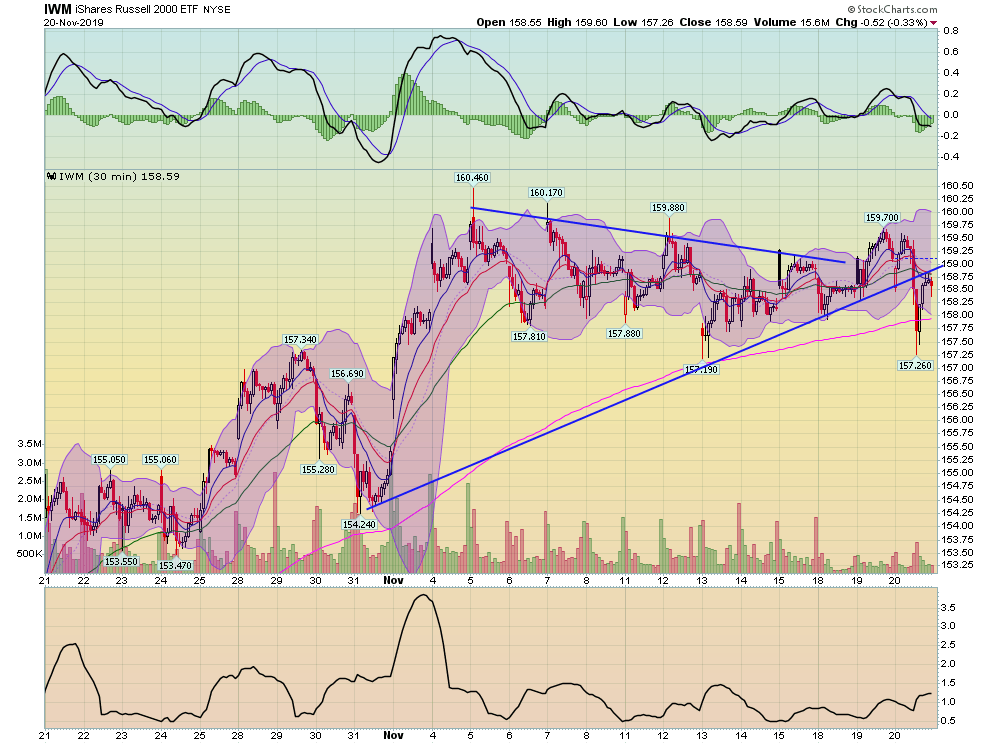
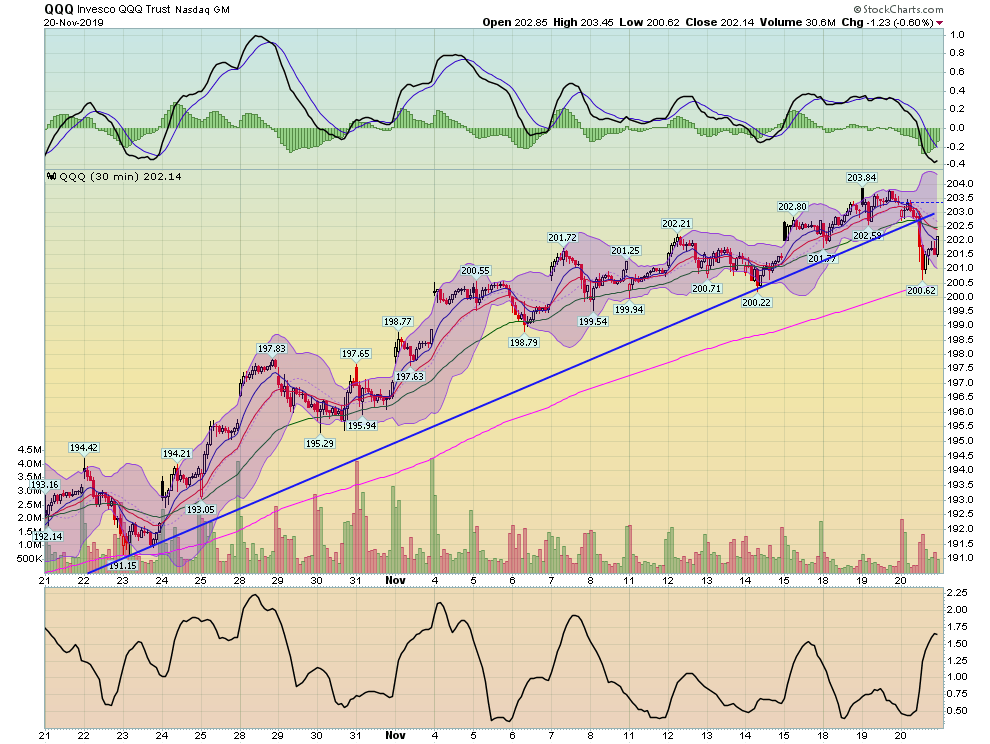
There were two key developments on the 30-day equity charts.
The iShares Russell 2000 (NYSE:IWM) broke the trendline that connected lows from October 31, November 10 and 18. Prices hit the 200-minute EMA and counter-rallied to hit resistance at the trendline.
The Invesco QQQ Trust (NASDAQ:QQQ) broke a longer trendline -- one that started on October 23. Volume spiked a bit during today's action.
We're also seeing some weakness in key sectors.
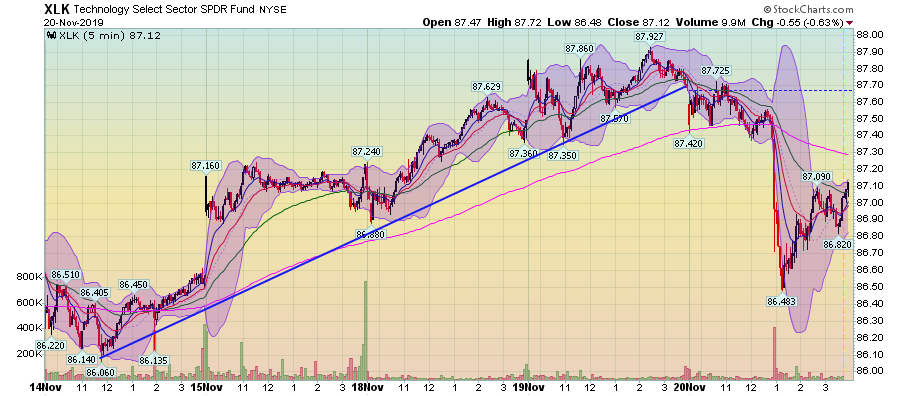
The technology ETF broke a 4-day trend line at the open. Prices accelerated on the selloff that started when Reuters reported that the US-China trade deal might not be signed until next year.

Only three of the largest XLK components were higher today -- NVIDIA Corporation (NASDAQ:NVDA), Salesforce.com (NYSE:CRM), and Mastercard (NYSE:MA). Apple (NASDAQ:AAPL) -- the second-largest member -- dropped over 1%.
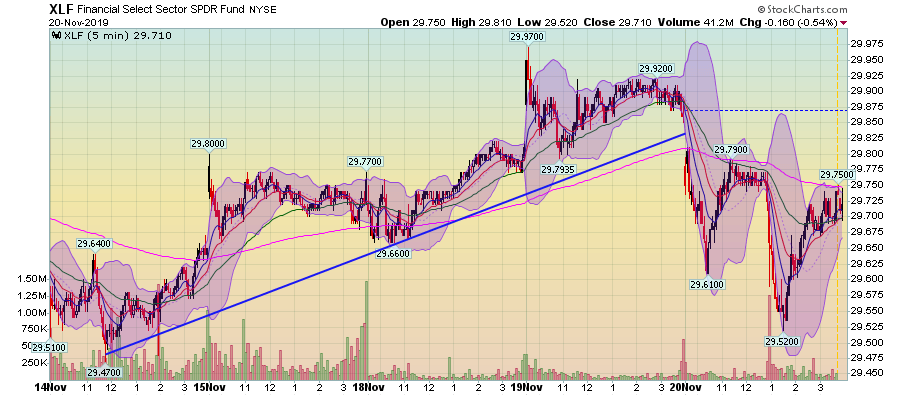
The financials Financial Select Sector SPDR (NYSE:XLF) also broke a 4-day trend today.

Only one of the 10 largest members of the XLF (CME) rose.
Going forward, the next few days are key. If the bulls want to regain control, they'll need to bid shares through the trendlines and make additional gains.
