Get 40% Off
👀 👁 🧿 All eyes on Biogen, up +4,56% after posting earnings. Our AI picked it in March 2024.
Which stocks will surge next?
Unlock AI-picked Stocks

3 Possible Moves Ahead For EUR/USD

Published 05/18/2015, 01:00 AM
Updated 07/09/2023, 06:31 AM

The EUR/USD has so far surprised many with its upward momentum. The key question now is not whether, but when will it turn around for another leg down. For signals about timing, technical analysis is usually more helpful and reliable than the fundamental analysis. The former is the tool to help decide where, when and how the price might move, while the latter is the force and the reasoning behind the big, longer-term moves.

Judging by the technical charts below, we see three potential moves ahead for the EUR/USD:

Scenario 1: The pair moves toward the confluence of the near daily supply zone (1.1545-1.1680), where it meets the 200-day moving average, and from there it resumes its long-term downtrend. This also coincides with the completion of the double bottom pattern, as the daily supply zone's distance from the double bottom's neckline is the same as the pattern's height (see chart, below). We believe this is the most likely scenario we'll be seeing this week.
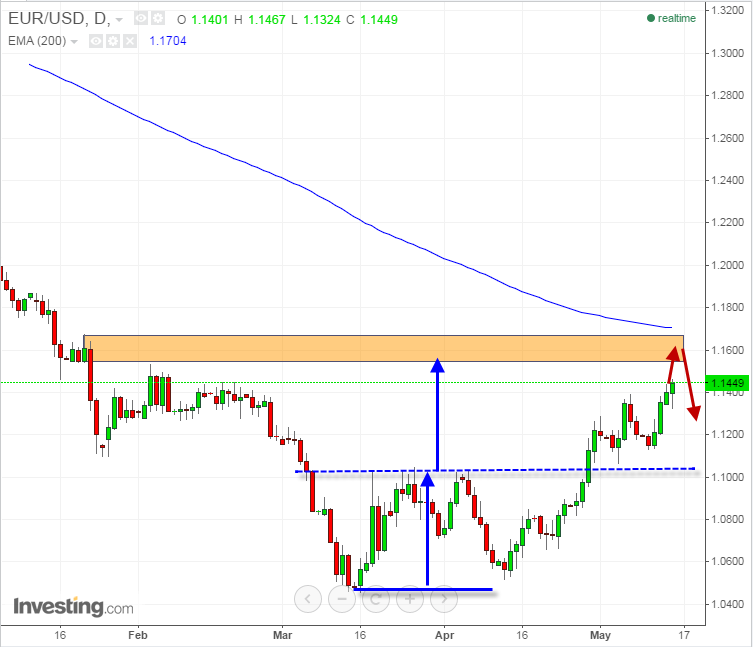
EUR/USD Daily Chart

If this becomes the case, we will then have to see how the pair handles the neckline. Closing below it will probably signal a continuation down; Holding above it with a clear price action signaling up will open the way for more gains in the levels above.

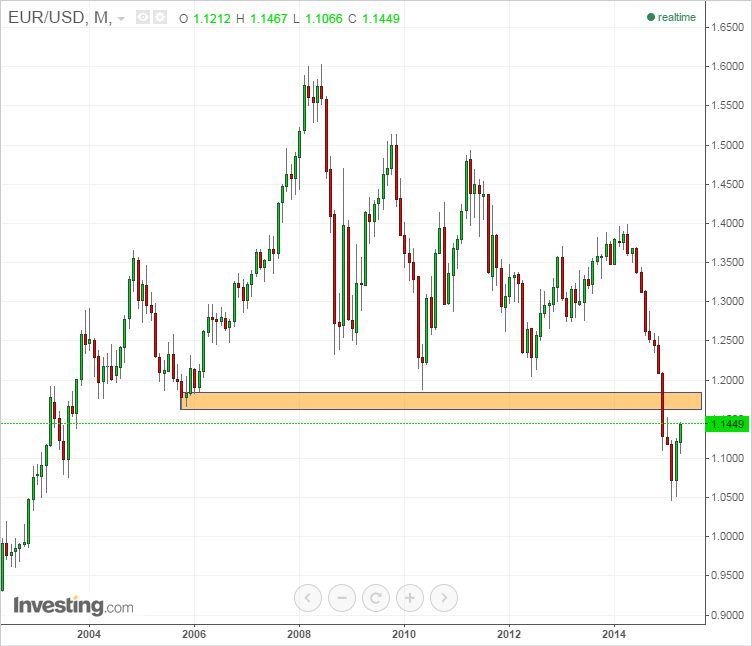
Scenario 2: The EUR/USD breaches the daily supply zone and continues moving a bit higher into the broken monthly demand zone. The bottom of this demand zone is actually the top of the aforementioned daily supply zone (around 1.1680), which means the market has already tested and confirmed the role-reversal of this broken zone. In this scenario, the top of the monthly zone - around 1.1840 - is the strongest resistance point. Waiting there for a reversal signal in the form of a daily price action (evening star, bearish engulf, shooting star) will give those who want to short the pair the best risk:reward ratio.
3rd party Ad. Not an offer or recommendation by Investing.com. See disclosure here or remove ads .

EUR/USD Monthly Chart

Scenario 3: After overcoming the hurdles mentioned above, the pair keeps moving even higher—toward a strong weekly trend-line, which managed to hold the price above this point for a few weeks. When the weekly candle closed below it, this became the signal for the bears to storm ahead, pushing the price almost 1700 pips lower. Currently, what looks to be the bears' last stronghold, awaits around 1.2270. However, as the weeks go by, it moves up (since it's a rising trend-line.)

This is the least likely scenario at the moment, but it is definitely not impossible, as long as the US Dollar Index keeps moving down, as mentioned last week.
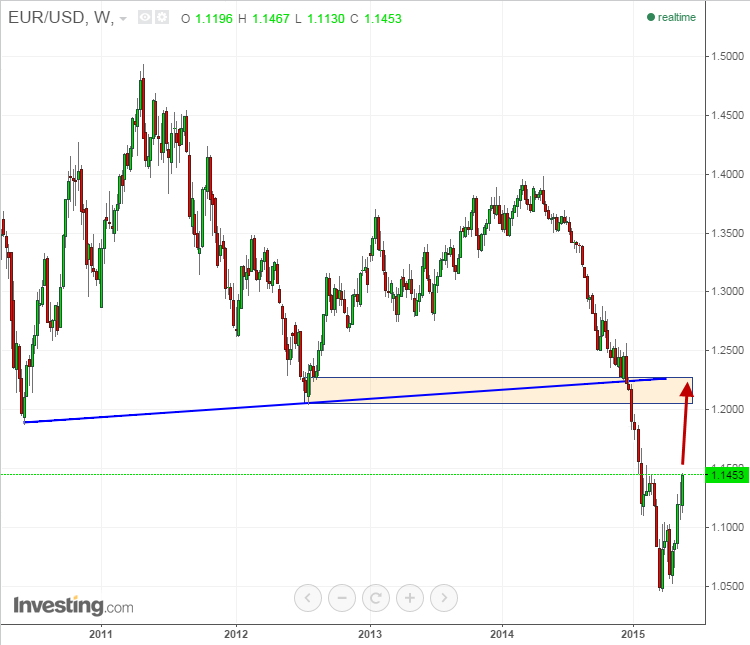
EUR/USD Weekly Chart

Latest comments

but this was totally wrong going by what is on now.i was deceived
How exactly was this wrong if you look at the dates when the article was published? They've labelled the charts with specific time frames in mind too.
Risk Disclosure: Trading in financial instruments and/or cryptocurrencies involves high risks including the risk of losing some, or all, of your investment amount, and may not be suitable for all investors. Prices of cryptocurrencies are extremely volatile and may be affected by external factors such as financial, regulatory or political events. Trading on margin increases the financial risks.
Before deciding to trade in financial instrument or cryptocurrencies you should be fully informed of the risks and costs associated with trading the financial markets, carefully consider your investment objectives, level of experience, and risk appetite, and seek professional advice where needed.
Fusion Media would like to remind you that the data contained in this website is not necessarily real-time nor accurate. The data and prices on the website are not necessarily provided by any market or exchange, but may be provided by market makers, and so prices may not be accurate and may differ from the actual price at any given market, meaning prices are indicative and not appropriate for trading purposes. Fusion Media and any provider of the data contained in this website will not accept liability for any loss or damage as a result of your trading, or your reliance on the information contained within this website.
It is prohibited to use, store, reproduce, display, modify, transmit or distribute the data contained in this website without the explicit prior written permission of Fusion Media and/or the data provider. All intellectual property rights are reserved by the providers and/or the exchange providing the data contained in this website.
Fusion Media may be compensated by the advertisers that appear on the website, based on your interaction with the advertisements or advertisers.
© 2007-2024 - Fusion Media Limited. All Rights Reserved.