While money has flowed out of BRIC ETFs (Brazil, Russia, India, China), Southeast Asia continues to be a hot spot with bullish chart patterns in Indonesia (EIDO), Thailand (THD), and Singapore ($EWS). When we first alerted you to these bullish patterns in our April 10 blog post, most of the chart patterns were not yet actionable. But now, at least two of them may be within the next few days.
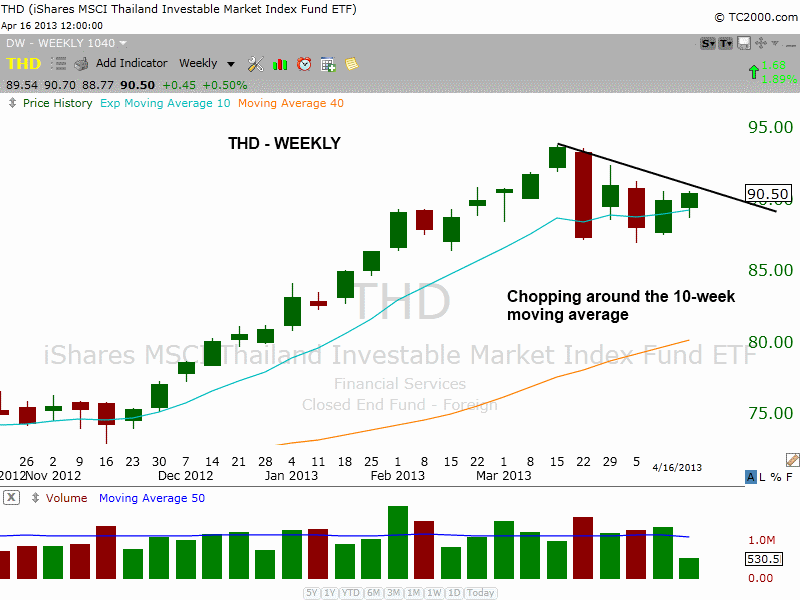
The iShares MSCI Thailand Index (THD) has formed a bullish basing pattern during the past five weeks, and has found support around the 10-week moving average, which is a bullish sign. On the weekly chart below, note the strong uptrend that has been in place:
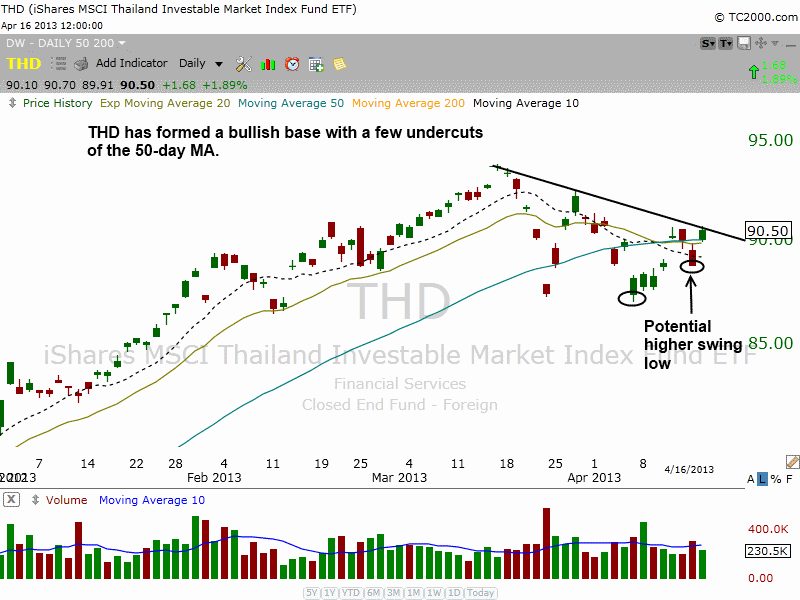
After three shakeouts below the 50-day moving average (on 3/22, 4/5, and 4/15), THD has reclaimed the 50-day MA and is poised to break out above the short-term downtrend line of the consolidation. This is shown on the daily chart interval below:
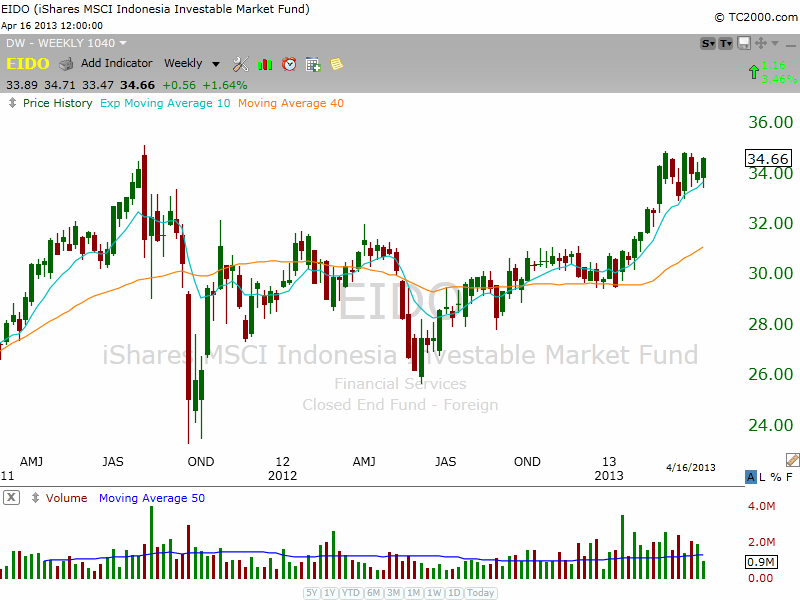
Another Southeast Asian ETF looking great is iShares MSCI Indonesia Fund (EIDO), which has formed a tight-ranged base while holding the rising 10-week moving average (roughly the same as the 50-day moving average on the daily chart), indicating that the price action is very tight.
We also see that the current base has formed just below the prior high of 2011, so a breakout above the current range should propel the action to new highs, with no overhead resistance. Check out the weekly chart pattern:
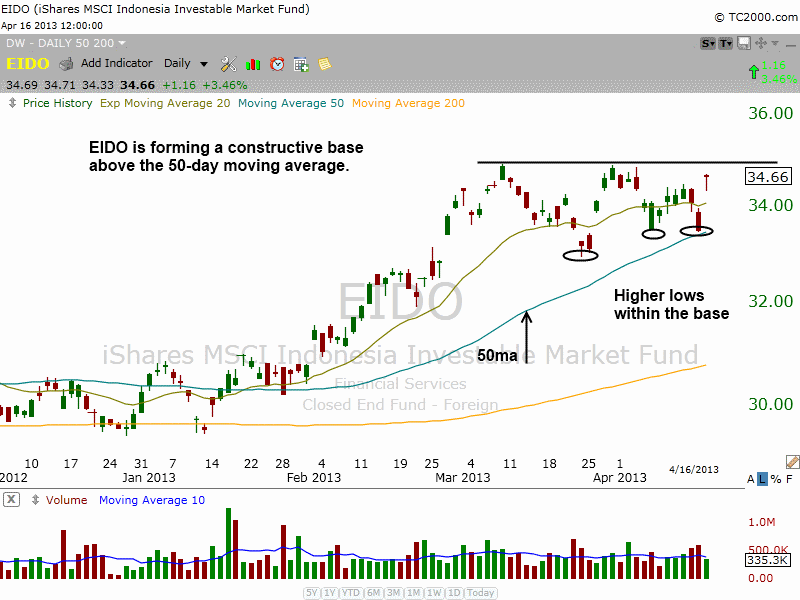
Drilling down to the daily chart (below), we see EIDO potentially forming “higher lows” within the base, which is a sign of constructive price action.
Further, this is the first pullback to the 50-day moving average since the base breakout in February. The first retracement to kiss the 50-day MA is typically where institutions step in to support price action of stocks and ETFs in a strong uptrend:
Both of the above ETFs we analyzed (EIDO and THD) are “official” setups for potential swing trade buy entry in today’s Wagner Daily swing trading newsletter. To receive immediate access to our precision trigger prices for buy entry, exact stop prices, and target prices for both $EIDO and $THD, sign up now for your risk-free trial membership at:
The market has been amazingly resilient since late February. The key to this rally is the action in leading stocks, which generally appear to be holding up well. To name a few, LinkedIN (LNKD), Amazon (AMZN), Tesla Motors (TSLA), eBay (EBAY), Ambarella (AMBA), Celgene (CELG), and Proto Labs (PRLB) are either holding steady or finding support at logical levels. Homebuilders and transportation stocks have not impressed lately, but they continue to base out and that is a good sign (check out the ITB and IYR ETFs). If top stocks continue to hold while new breakouts emerge, the broad based averages will follow suit.
Original post
- English (UK)
- English (India)
- English (Canada)
- English (Australia)
- English (South Africa)
- English (Philippines)
- English (Nigeria)
- Deutsch
- Español (España)
- Español (México)
- Français
- Italiano
- Nederlands
- Português (Portugal)
- Polski
- Português (Brasil)
- Русский
- Türkçe
- العربية
- Ελληνικά
- Svenska
- Suomi
- עברית
- 日本語
- 한국어
- 简体中文
- 繁體中文
- Bahasa Indonesia
- Bahasa Melayu
- ไทย
- Tiếng Việt
- हिंदी
2 Asian ETFs Ready To Cruise Higher
Published 04/17/2013, 07:09 AM
Updated 07/09/2023, 06:31 AM
2 Asian ETFs Ready To Cruise Higher
3rd party Ad. Not an offer or recommendation by Investing.com. See disclosure here or
remove ads
.
Latest comments
Install Our App
Risk Disclosure: Trading in financial instruments and/or cryptocurrencies involves high risks including the risk of losing some, or all, of your investment amount, and may not be suitable for all investors. Prices of cryptocurrencies are extremely volatile and may be affected by external factors such as financial, regulatory or political events. Trading on margin increases the financial risks.
Before deciding to trade in financial instrument or cryptocurrencies you should be fully informed of the risks and costs associated with trading the financial markets, carefully consider your investment objectives, level of experience, and risk appetite, and seek professional advice where needed.
Fusion Media would like to remind you that the data contained in this website is not necessarily real-time nor accurate. The data and prices on the website are not necessarily provided by any market or exchange, but may be provided by market makers, and so prices may not be accurate and may differ from the actual price at any given market, meaning prices are indicative and not appropriate for trading purposes. Fusion Media and any provider of the data contained in this website will not accept liability for any loss or damage as a result of your trading, or your reliance on the information contained within this website.
It is prohibited to use, store, reproduce, display, modify, transmit or distribute the data contained in this website without the explicit prior written permission of Fusion Media and/or the data provider. All intellectual property rights are reserved by the providers and/or the exchange providing the data contained in this website.
Fusion Media may be compensated by the advertisers that appear on the website, based on your interaction with the advertisements or advertisers.
© 2007-2024 - Fusion Media Limited. All Rights Reserved.
