
High beta stocks are risky but they also offer big opportunities for investors. And the technology sector offers investors a huge base with quite a few risk-adjusted business models.
Today I'm screening for high beta technology dividend stocks. Because of the huge amount of high beta dividend paying technology stocks, I've added three additional filters to my screen: high market capitalization, expected five year earnings per share growth as well as low forward price-to-earnings ratios.
Growth should be over 10 percent for the next half decade and the P/E should below 15. In my view, this ratio represents a very good price for a future growth opportunity but the business model could be much riskier because of the high beta ratio. The betas of the 19 results are between 1.3 and 4. Some stocks, like Telecom Italia, Orange or Broadcom have a really bad mid-term performance. Others, like TE Connectivity or Eaton saw increased performance during the same period by over 55 percent or more.
Intel (INTC) has a market capitalization of $115.54 billion. The company employs 106,000 people, generates revenue of $53.341 billion and has a net income of $11.005 billion. Intel’s earnings before interest, taxes, depreciation and amortization (EBITDA) amounts to $22.160 billion. The EBITDA margin is 41.54 percent (the operating margin is 27.44 percent and the net profit margin 20.63 percent).
Financial Analysis: The total debt represents 15.94 percent of Intel’s assets and the total debt in relation to the equity amounts to 26.26 percent. Due to the financial situation, a return on equity of 22.66 percent was realized by Intel. Twelve trailing months earnings per share reached a value of $1.85. Last fiscal year, Intel paid $0.87 in the form of dividends to shareholders.
Market Valuation: Here are the price ratios of the company: The P/E ratio is 12.55, the P/S ratio is 2.17 and the P/B ratio is finally 2.24. The dividend yield amounts to 3.88 percent and the beta ratio has a value of 1.01.
Orange (ORAN) has a market capitalization of $25.97 billion. The company employs 167,835 people, generates revenue of $57.791 billion and has a net income of $1.466 billion. Orange’s earnings before interest, taxes, depreciation and amortization (EBITDA) amounts to $16.433 billion. The EBITDA margin is 28.44 percent (the operating margin is 9.34 percent and the net profit margin 2.54 percent).
Financial Analysis: The total debt represents 44.24 percent of Orange’s assets and the total debt in relation to the equity amounts to 163.77 percent. Due to the financial situation, a return on equity of 3.16 percent was realized by Orange. Twelve trailing months earnings per share reached a value of $0.06. Last fiscal year, Orange paid $1.83 in the form of dividends to shareholders.
Market Valuation: Here are the price ratios of the company: The P/E ratio is 158.22, the P/S ratio is 0.45 and the P/B ratio is finally 0.80. The dividend yield amounts to 6.71 percent and the beta ratio has a value of 0.85.
CA Technologies (CA) has a market capitalization of $13.77 billion. The company employs 13,600 people, generates revenue of $4.643 billion and has a net income of $955.00 million. CA Technologies’s earnings before interest, taxes, depreciation and amortization (EBITDA) amounts to $1.924 billion. The EBITDA margin is 41.44 percent (the operating margin is 29.33 percent and the net profit margin 20.57 percent).
Financial Analysis: The total debt represents 10.92 percent of CA Technologies’s assets and the total debt in relation to the equity amounts to 23.67 percent. Due to the financial situation, a return on equity of 17.41 percent was realized by CA Technologies. Twelve trailing months earnings per share reached a value of $2.30. Last fiscal year, CA paid $1.00 in the form of dividends to shareholders.
Market Valuation: Here are the price ratios of the company: The P/E ratio is 13.21, the P/S ratio is 2.98 and the P/B ratio is finally 2.50. The dividend yield amounts to 3.29 percent and the beta ratio has a value of 1.04.
Telecom Italia (TI) has a market capitalization of $12.63 billion. The company employs 82,941 people, generates revenue of $39.578 billion and has a net income of $-1,698.63 million. Telecom Italia’s earnings before interest, taxes, depreciation and amortization (EBITDA) amounts to $15.304 billion. The EBITDA margin is 38.67 percent (the operating margin is 6.46 percent and the net profit margin -4.29 percent).
Financial Analysis: The total debt represents 48.10 percent of Telecom Italia’s assets and the total debt in relation to the equity amounts to 192.50 percent. Due to the financial situation, a return on equity of -7.73 percent was realized by Telecom Italia. Twelve trailing months earnings per share reached a value of $-1.26. Last fiscal year, Telecom Italia paid $0.27 in the form of dividends to shareholders.
Market Valuation: Here are the price ratios of the company: The P/E ratio is not calculable, the P/S ratio is 0.30 and the P/B ratio is finally 0.49. The dividend yield amounts to 3.97 percent and the beta ratio has a value of 1.12.
Take a closer look at the full list of cheap high beta technology dividend stocks with big growth forecasts. The average P/E ratio amounts to 19.16 and forward P/E ratio is 11.71. The dividend yield has a value of 2.23 percent. Price to book ratio is 2.95 and price to sales ratio 11.71. The operating margin amounts to 20.15 percent and the beta ratio is 1.15. Stocks from the list have an average debt to equity ratio of 0.56.
Here is the full table with some fundamentals (TTM):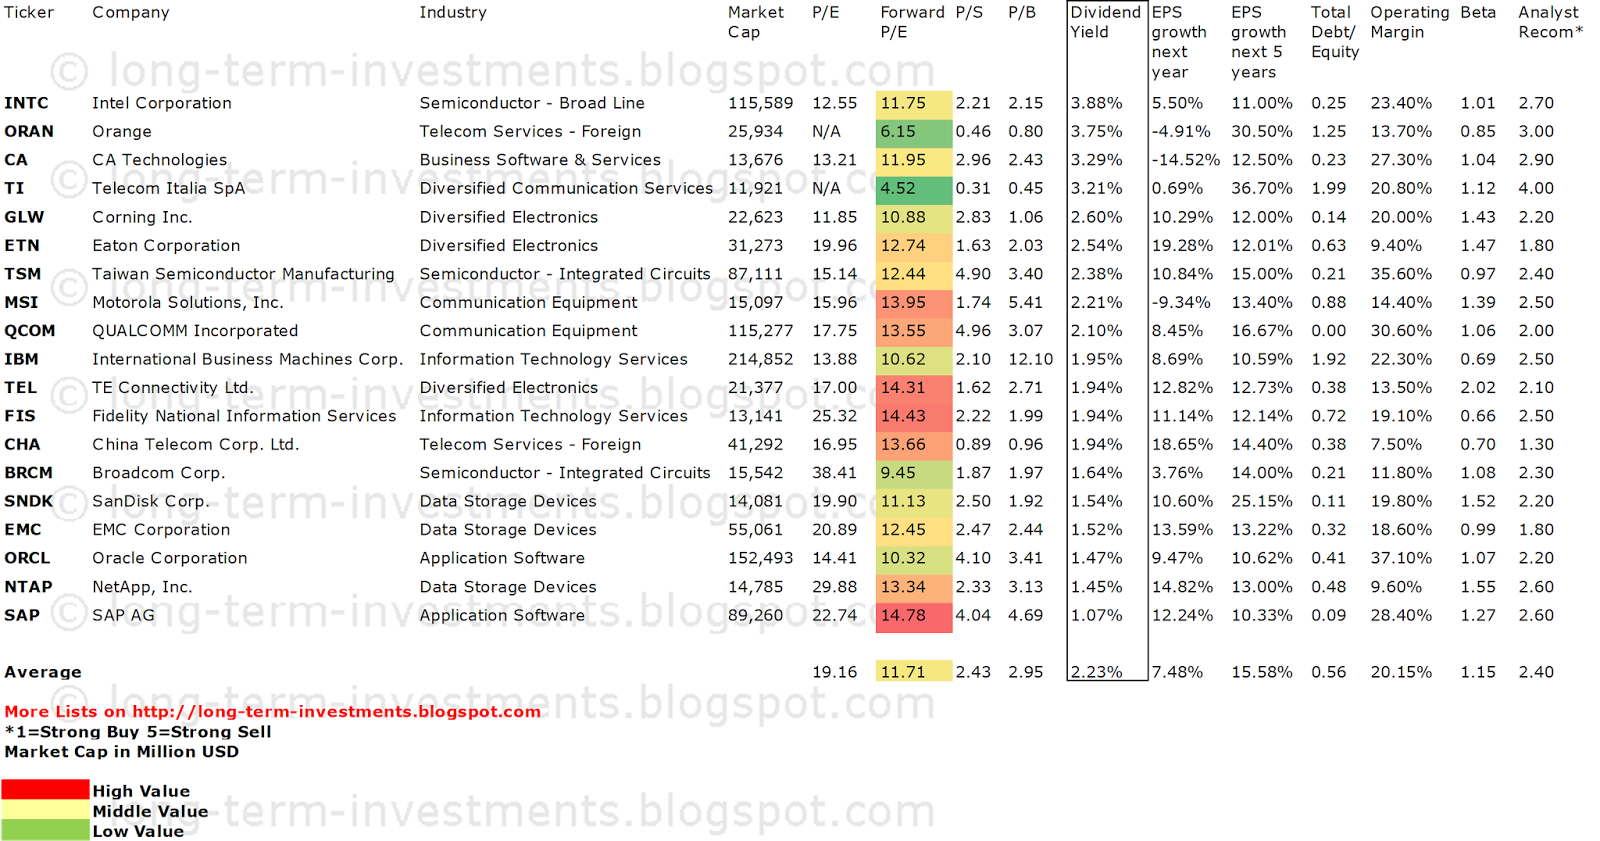
Related Stock Ticker Symbols: INTC, ORAN, CA, TI, GLW, ETN, TSM, MSI, QCOM, IBM, TEL, FIS, CHA, BRCM, SNDK, EMC, ORCL, NTAP, SAP
Disclosure: I am long INTC, CA, QCOM, ORCL, IBM. I receive no compensation to write about these specific stocks, sector or theme. I don't plan to increase or decrease positions or obligations within the next 72 hours.
For the other stocks: I have no positions in any stocks mentioned, and no plans to initiate any positions within the next 72 hours. I receive no compensation to write about any specific stock, sector or theme.
- English (UK)
- English (India)
- English (Canada)
- English (Australia)
- English (South Africa)
- English (Philippines)
- English (Nigeria)
- Deutsch
- Español (España)
- Español (México)
- Français
- Italiano
- Nederlands
- Português (Portugal)
- Polski
- Português (Brasil)
- Русский
- Türkçe
- العربية
- Ελληνικά
- Svenska
- Suomi
- עברית
- 日本語
- 한국어
- 简体中文
- 繁體中文
- Bahasa Indonesia
- Bahasa Melayu
- ไทย
- Tiếng Việt
- हिंदी
19 Reasonably Priced, High Beta Technology Dividend Stocks
Published 08/05/2013, 05:57 AM
Updated 07/09/2023, 06:31 AM
19 Reasonably Priced, High Beta Technology Dividend Stocks
3rd party Ad. Not an offer or recommendation by Investing.com. See disclosure here or
remove ads
.
Latest comments
Install Our App
Risk Disclosure: Trading in financial instruments and/or cryptocurrencies involves high risks including the risk of losing some, or all, of your investment amount, and may not be suitable for all investors. Prices of cryptocurrencies are extremely volatile and may be affected by external factors such as financial, regulatory or political events. Trading on margin increases the financial risks.
Before deciding to trade in financial instrument or cryptocurrencies you should be fully informed of the risks and costs associated with trading the financial markets, carefully consider your investment objectives, level of experience, and risk appetite, and seek professional advice where needed.
Fusion Media would like to remind you that the data contained in this website is not necessarily real-time nor accurate. The data and prices on the website are not necessarily provided by any market or exchange, but may be provided by market makers, and so prices may not be accurate and may differ from the actual price at any given market, meaning prices are indicative and not appropriate for trading purposes. Fusion Media and any provider of the data contained in this website will not accept liability for any loss or damage as a result of your trading, or your reliance on the information contained within this website.
It is prohibited to use, store, reproduce, display, modify, transmit or distribute the data contained in this website without the explicit prior written permission of Fusion Media and/or the data provider. All intellectual property rights are reserved by the providers and/or the exchange providing the data contained in this website.
Fusion Media may be compensated by the advertisers that appear on the website, based on your interaction with the advertisements or advertisers.
© 2007-2024 - Fusion Media Limited. All Rights Reserved.