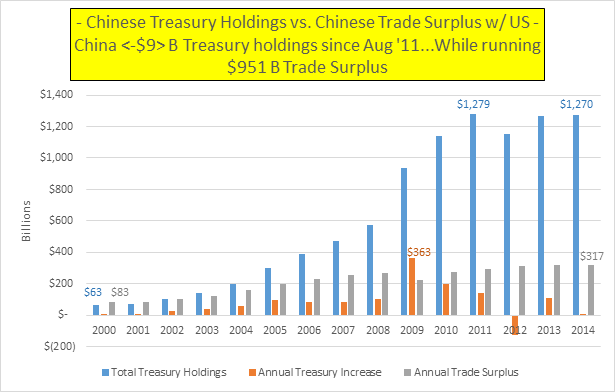
Since August ’11 to August of ’14, China has decreased its holdings of US Treasury debt by $9 Billion (according to the most recent TIC data)…while continuing to run record trade surpluses with the US. This means China will have (by year end 2014) taken in $951 Billion in shiny, new, digital dollars since 2011 and simultaneously sold or rolled off $9 Billion in US Treasury holdings…so China will have had to find a home for $960 Billion new dollars.
From ’00 to ’11, China had (on average) recycled 50% of its trade surplus dollar reserves into Treasury’s. However, as noted above, China has been a net seller since August ’11…why is this date important? It was the month after the debt ceiling fiasco…and the date when China’s purported gold purchase binge began. It’s was also August ’11 that gold hit its peak price and has fallen since. I don’t think these happenings are a coincidence.
Since we know China didn’t buy Treasury’s over this period, perhaps we should speculate what those new dollars would do if focused on gold purchases?!? If China rotated the 50% of surplus dollars it had been utilizing to buy Treasury’s and instead bought Gold…at an average of say $1500 an ounce since Aug ’11…that would buy China exactly 10,000*** tons of gold by year end 2014. Hmmm…Implications abound.

***Math check…$960,000,000,000 * 0.50% = $480,000,000,000 / $1500 per oz. gold = 320,000,000 million oz. / 32,000 oz. per ton = 10,000 tons of Gold.
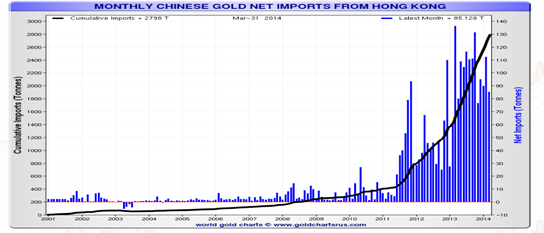
Of course I can’t prove that China did purchase any amount of gold. The Chinese authorities haven’t made any updates since 2009 when they last made public a 600 ton increase (to their then official holdings of 454 tons) to the current official Chinese gold reserve of 1054.1 tons. What I can say is Russia, which likewise has a large dollar trade surplus and likewise to China has been reducing its Treasury exposure since August of 2011…has been busily and openly adding to its gold reserves, now up to 1153.3 tons. Then again, I (nor the US government?) can’t prove the US truly has 8133.5 tons. Or the Germans 3384.2 tons or Italians 2451.8 tons. Still waiting on those open and transparent audits.All I can say is the above math regarding China’s dollar hoard would nicely support what is visible in the chart below and also support those that claim Chinese gold buying and gold reserves are far larger than advertised.

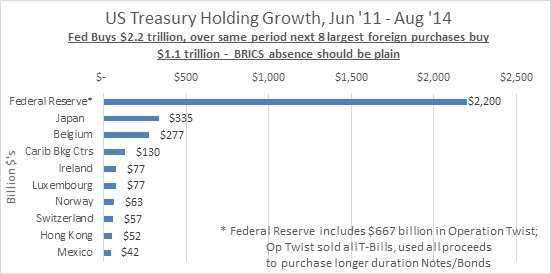
AND — A quick reminder of who did buy US Treasury debt from August of ’11 til now…sort of a who’s who of banking and digital dollars…noticeably missing are those who have actual dollar reserves in need of recycling!!!

When even a liberal arts major can do the math…this Ponzi scheme must be wearing pretty thin!!!
As a follow up – I was asked if the large Treasury holdings increase in Belgium could represent Chinese purchasing? Here’s my two cents:
No way to know for sure – but China’s usual outlets for secondary Treasury purchases were
Historically through Hong Kong or the UK and potentially also via Canada…I didn’t get into this in the article but it was the UK that from June to July of 2011 dumped $208 B in Treasury’s and by October of ’11 had dumped $240 B of the UK’s original $347 B (70% reduction in holdings). Canada likewise dumped $49 B (52%) from June to July of ‘11. The UK now has recouped some to $170 B but still only half of what it owned in June of ’11…Canada likewise has recovered some to $65 B. HK has been steady and slightly growing the whole while. China’s official holdings peaked in July of ’11 at $1315 B and suddenly also declined to $1150 B by year end 2011.
It’s a pretty safe bet this was China or its agents selling what amounted to $435 B or 35% of China’s official Treasury holdings…and it was Belgium who held $34 B in June of ’11 that suddenly began its moonshot to its current holding of $360 B…an addition of $330 B. However, many also want to attribute some portion of Belgium’s rise to Russia whose Treasury holdings peaked in October 2010 at $176 B and have fallen to their current holding of $118 B ($58 B reduction…or a 33% reduction).
Was there a connection between the $435 B sold between China / Canada / UK and the $324 B subsequently purchased in Belgium? Seems a fair bet. But even more importantly, that would only represent a repositioning of China’s Treasury holdings and would still indicate China has been nothing but a net seller since ’11 (the other option is China actually did sell and has an additional $400+ billion on top of the $960 B in trade surplus all in need of PM’s, stocks, and/or real estate). The premise that all those dollars in trade surplus from ’11 till now need go somewhere still seems valid.
