The latest YouGov survey showed that the pro-unionists campaign moved back into a narrow lead before the September 18 Scottish vote. With less than a week to go until the Scottish independence referendum, the pound rallied following the survey, but failed to fill Monday’s gap. The gap down was formed when a poll from the same opinion firm put the Yes campaign ahead for the first time. Next week a number of surveys are expected to be released, that could give us a better view on the tight referendum race. The uncertainty over the outcome has increased dramatically and if any of the polls show signs that “Yes” votes gain, this could push Cable further down. On the other hand, a “No” vote is likely to see much of the GBP losses recovered.
Less momentous than Scotland’s referendum but equally important, is Sweden’s general elections this Sunday. Thursday’s data showed that the Swedish economy fell back to deflation and the official and PES unemployment rates both increased. On top of the recent poor data, the worse-than-expected figures add to the growing body of evidence that Sweden’s economy is worsening. The data raise concerns over the present government’s administration and questions whether Riksbank’s unexpected 50 bps rate cut at their June meeting had any positive impact on the country’s economy. Recent polls have shown that neither of the two major blocs will win a majority, reflecting somehow the fragile handling of the nation’s economy and increasing the possibilities for a political turmoil on Sunday’s elections. The tight and complicated situation over the possible outcome, especially a minority-government, could weaken the Nordic currency for a long time.
Overnight from New Zealand, BusinessNZ manufacturing PMI rose in August from the previous month, while REINZ house sales dropped 16.3% yoy in August from -13.0% yoy in July. The mixed data had no major impact on Kiwi. Yet, NZD and other commodity currencies kept their downtrend due to declining commodity prices.
Today, Eurozone’s industrial production for July is expected to rise on a mom basis, a turnaround from June’s reading.
In the UK, construction output for July is coming out and the market consensus is for the pace to have declined.
In the US, we get retail sales for August. Both the headline figure and sales excluding the volatile items of autos and gasoline are forecast to accelerate, adding strength to the greenback ahead of the September 16-17 FOMC meeting. The minutes of the meeting released on October 8 will most likely reveal that the discussions over the timing of the first rate hike are becoming more intense. The preliminary University of Michigan consumer confidence sentiment for September is also coming out.
We have two speakers on Friday’s agenda. Bank of Japan Governor Haruhiko Kuroda and European Central Bank Governing council member Jens Weidmann speak.
The Market
EUR/USD still quiet
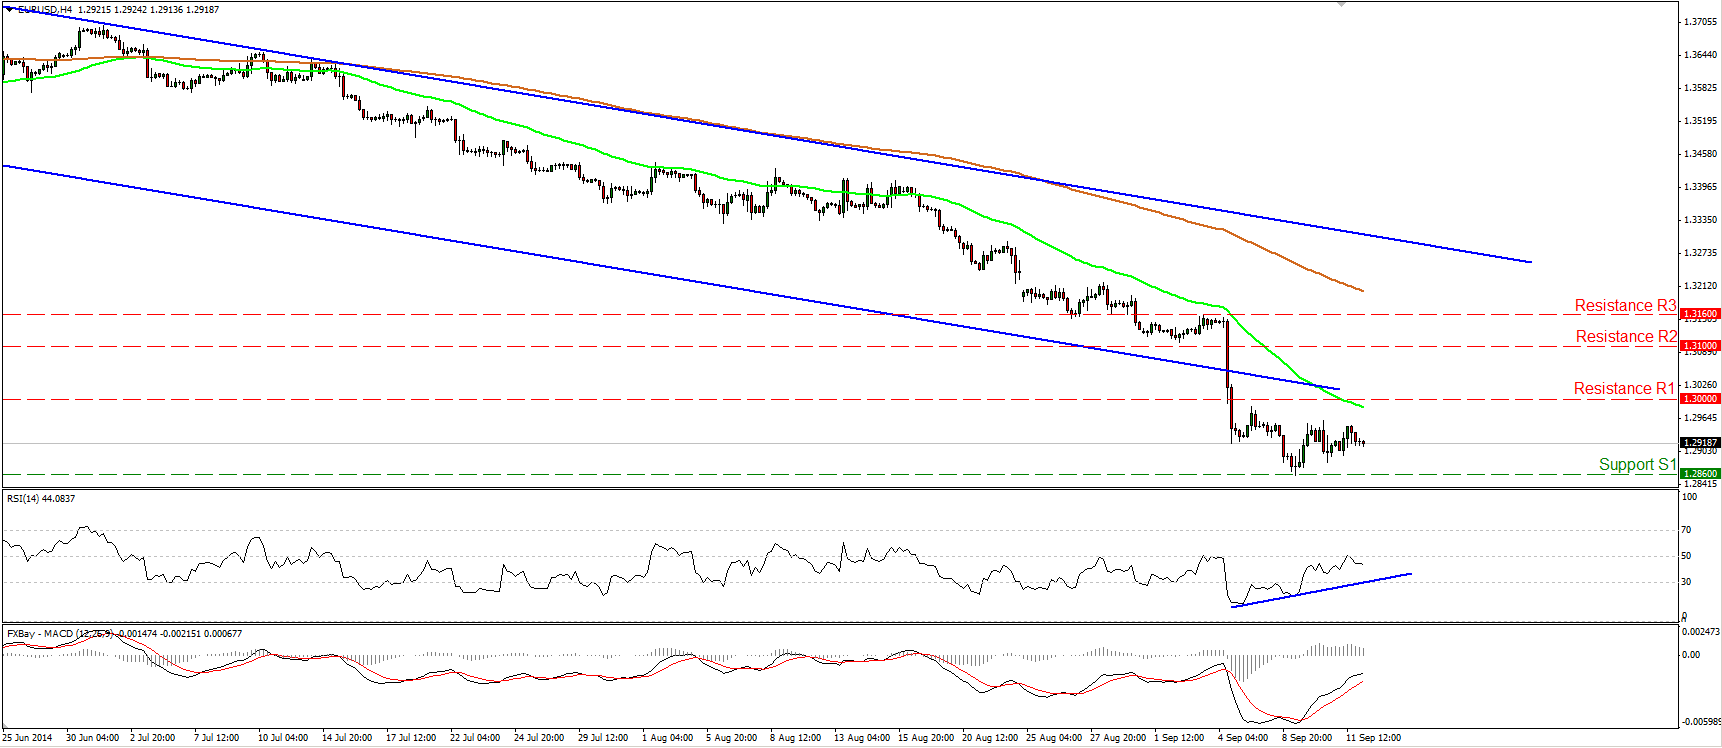
EUR/USD continued moving quietly, remaining between the support line of 1.2860 (S1) and the psychological barrier of 1.3000 (R1). The MACD continued higher after crossing above its trigger, while the positive divergence between the RSI and the price action is still in effect. Bearing these signs in mind, I will stick to the view that we may see the pair slightly higher in the close future, maybe to test the psychological line of 1.3000 (R1) as a resistance this time. Nevertheless, on the daily chart, the price structure remains lower highs and lower lows below both the 50- and the 200-day moving averages, thus I still see a negative overall picture. A clear move below 1.2860 (S1), is likely to trigger extensions towards the key support zone of 1.2760 (S2), defined by the lows of March and July 2013.
• Support: 1.2860 (S1), 1.2760 (S2), 1.2660 (S3).
• Resistance: 1.3000 (R1), 1.3100 (R2), 1.3160 (R3).
USD/JPY surges above 107.00
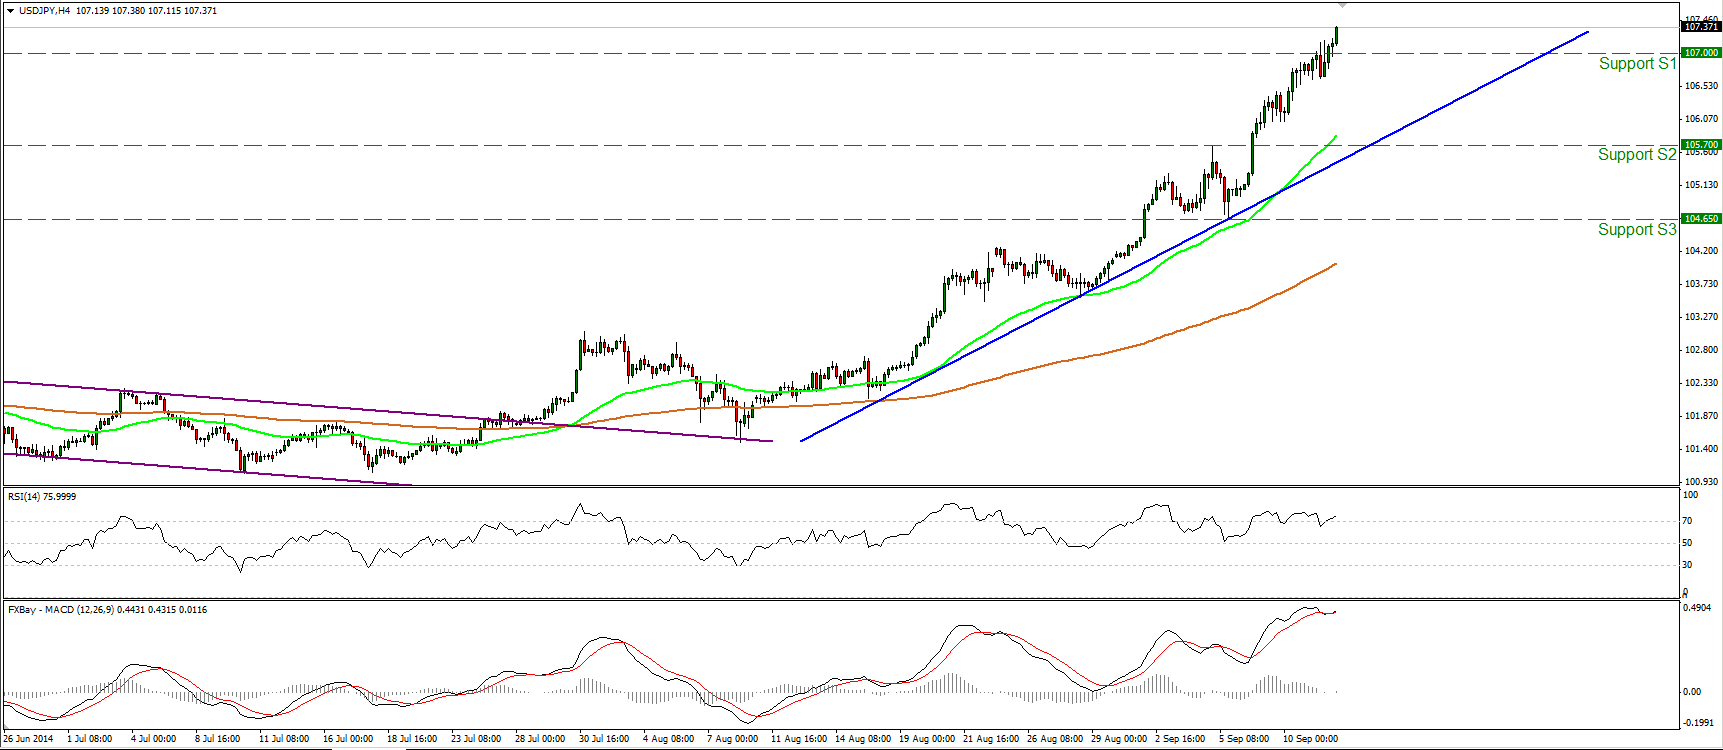
USD/JPY accelerated higher, violating the 107.00 line for the first time since September 2008. I believe that such a move could open the way for the 108.00 (R1) line, defined by the highs of the 19th of September 2008. I will repeat that as long as the price is trading above the blue uptrend line and above both the moving averages, I consider the near-term bias to be to the upside. Shifting our attention to our momentum studies, the MACD, already positive, crossed again above its signal line, while the RSI does not seem willing to exit its overbought zone any time soon. This designates aggressive bullish momentum and corroborates my view for further advances. In the bigger picture, I still see a newborn long-term uptrend, since, after the exit of a triangle, the price structure remains higher highs and higher lows above both the 50- and the 200-day moving averages.
• Support: 107.00 (S1), 105.70 (S2), 104.65 (S3).
• Resistance: 108.00 (R1), 109.00 (R2), 110.00 (R3).
AUD/USD plunges below 91.00
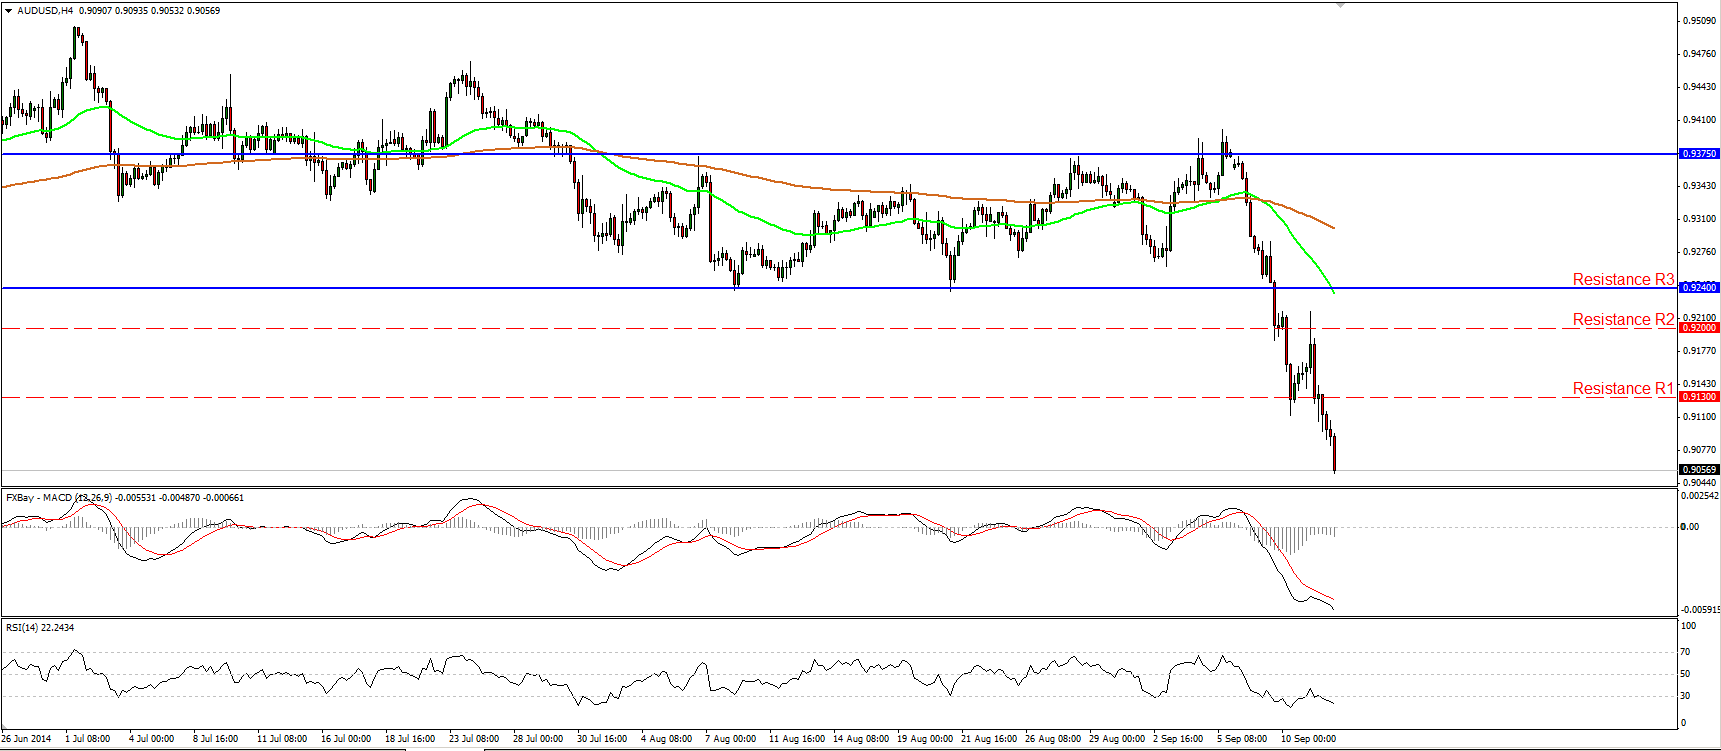
AUD/USD collapsed and fell below our barrier of 0.9130 (support turned into resistance) after finding resistance near the 0.9200 (R2) line. I would expect the plunge to continue and challenge the psychological hurdle of 0.9000 (S1) and if the bears are strong enough to ignore that line, I would expect them to pull the trigger for extensions towards the support level of 0.8920 (S2), the low of the 12th of March. In the bigger picture, the dip below 0.9240 signalled the downside exit of the sideways path (marked by the blue horizontal lines) and turned the picture negative. Our daily momentum indicators support the negative outlook, since the MACD dipped below both its zero and signal lines, while the RSI entered its oversold zone, but is still pointing down.
• Support: 0.9000 (S1), 0.8920 (S2), 0.8890 (S3).
• Resistance: 0.9130 (R1), 0.9200 (R2), 0.9240 (R3).
Gold breaks the lower bound of the channel
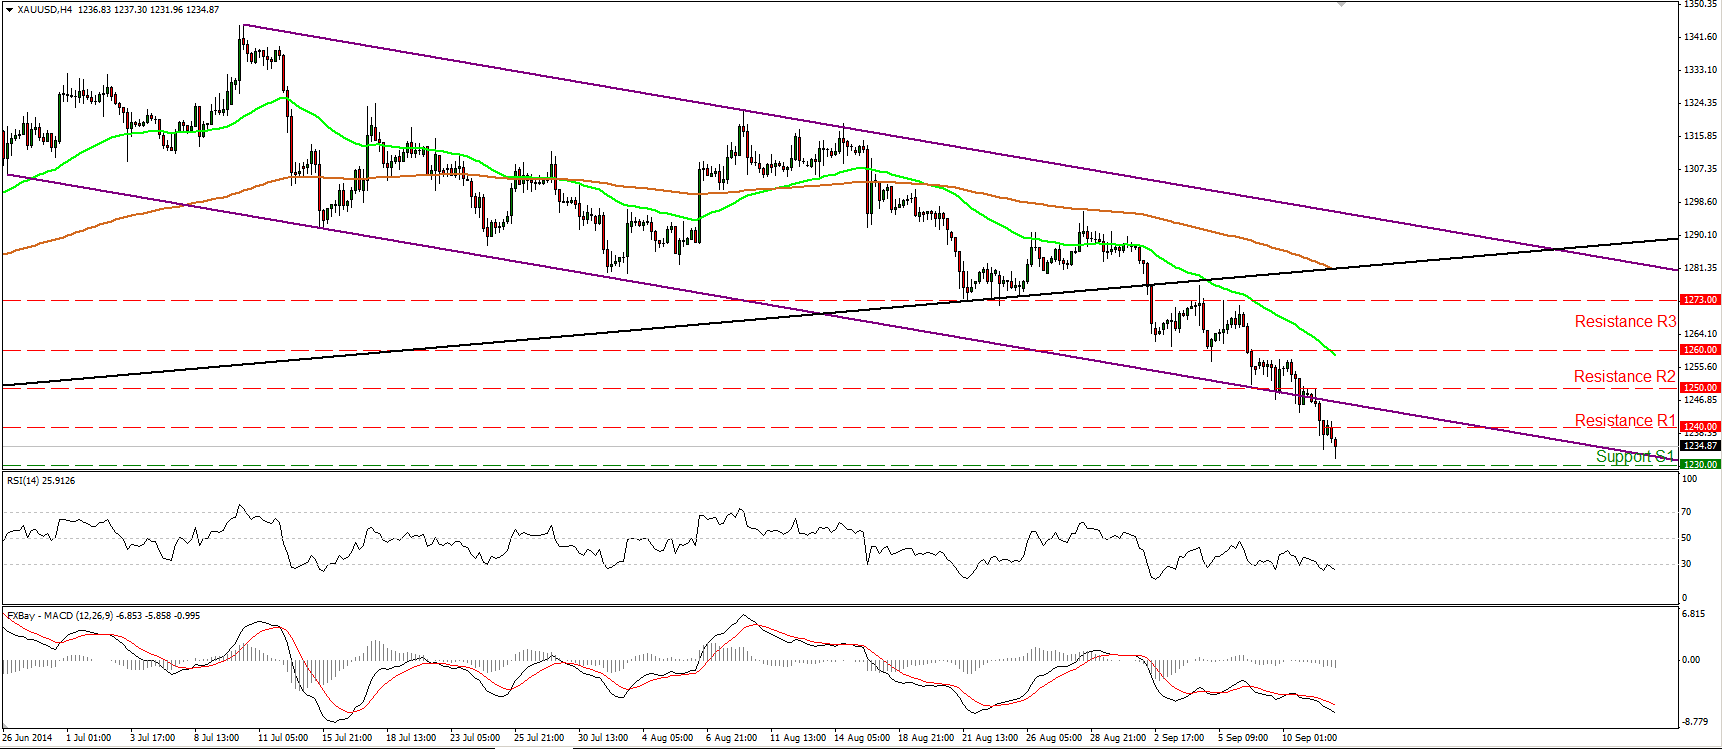
Gold continued declining on Thursday, falling below the 1240 barrier (support turned into resistance), defined by the lows of the 3rd of June. During the early European morning, the precious metal is heading towards the support line of 1230 (S1), where a break could trigger extensions towards the next support hurdle at 1220 (S2). The RSI entered its oversold field, but is pointing down, while the MACD, already negative, crossed below its trigger line. These momentum signs indicate accelerating negative momentum and amplify the case for further declines in the near future. In the bigger picture, the precious metal is printing lower highs and lower lows below bot the 50- and 200-day moving averages, and below black line drawn from back at the low of the 31th of December. As a result I consider the overall path of the yellow metal to be to the downside.
• Support: 1230 (S1), 1220 (S2), 1200 (S3).
• Resistance: 1240 (R1), 1250 (R2), 1260 (R3).
WTI rebounds from slightly above 90.00
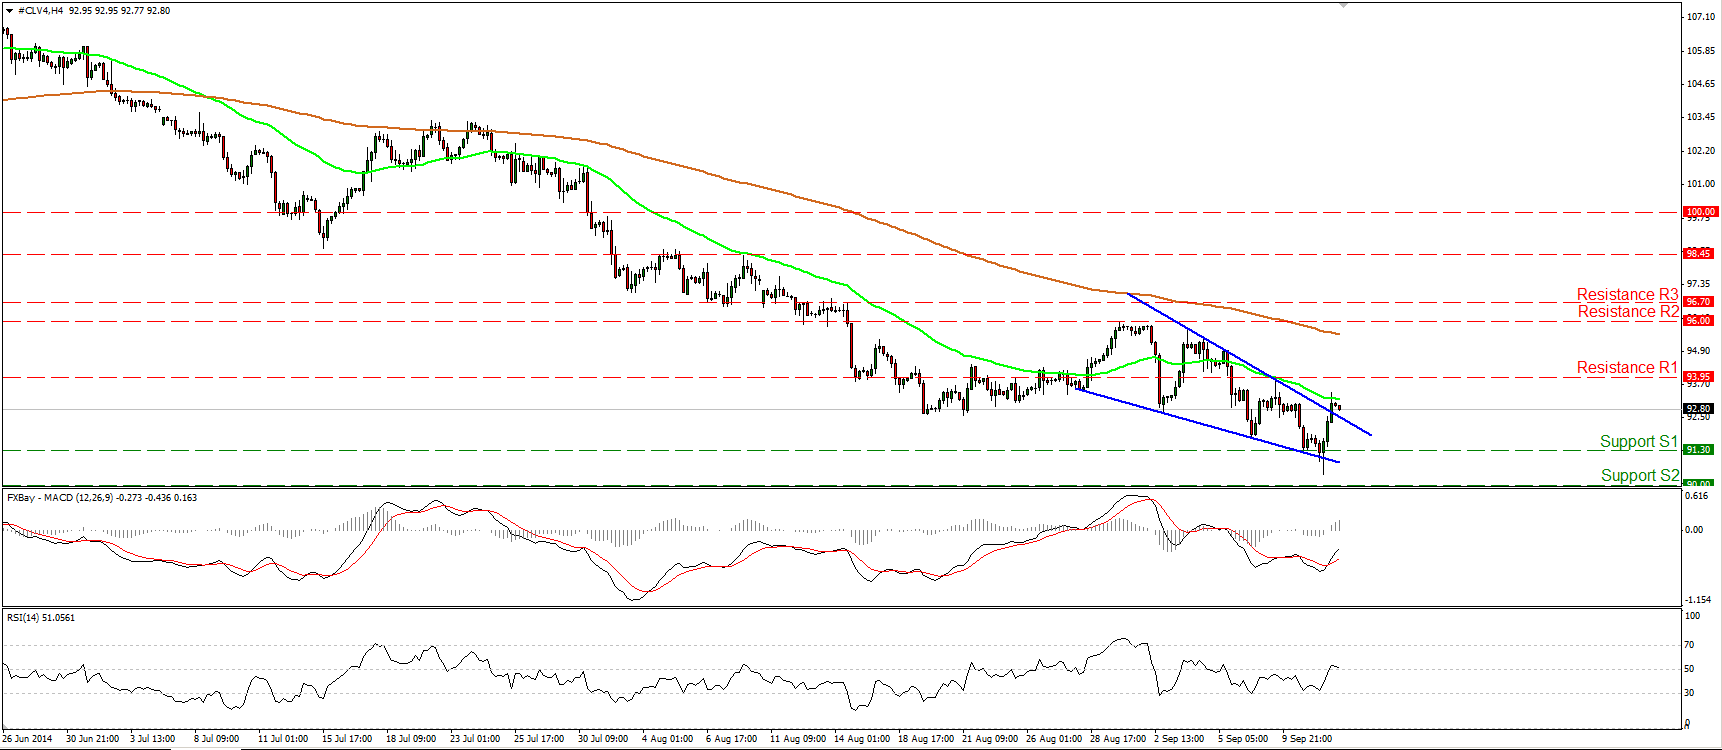
WTI tried to move lower but found some buy orders between the barriers of 90.00 (S2) and 91.30 (S1). The price rebounded and moved above the upper bound of the possible wedged pattern. However, as I said in yesterday’s comment, I would maintain my neutral stance until I see a clear move above 93.95 (R1). Such a move is likely to confirm the break out in my view and could set the stage for extensions towards our next resistance of 96.00 (R2). On the downside, we need a dip below 90.00 (S2) to have a forthcoming lower low, something that could signal the continuation of the prior downtrend and perhaps target the 85.75 (S3) area, defined by the lows of the 18th of April 2013.
• Support: 91.30 (S1), 90.00 (S2), 85.75 (S3).
• Resistance: 93.95 (R1), 96.00 (R2), 96.70 (R3) .

