In what’s been dubbed “Black Monday”, US stocks collapsed across the board, with the widely watched Dow Jones Industrial Average of 30 massive US companies falling by over 1,000 points early in the session. Stocks did bounce from those panic lows, but the DJIA still closed the day down nearly 600 points, garnering top story treatment on the evening news across the US (and a bunch of panicked calls from my non-financially-inclined friends and family members).
After the selloff spilled back over into Asian markets, the People’s Bank of China (PBOC) decided to put its foot down and took action to try to stem the decline. The central bank cut interest rates for the fifth time in the last nine months, dropping the 1-year deposit and lending rates by 25bps to 1.75% and 4.6% respectively. The PBOC also cut its reserve requirement ratio (RRR), or the proportion of deposits that large Chinese banks must hold to protect against credit losses, by 0.5% to 18%.
The immediate economic impact of these moves is likely to be limited, but at least they show that global policymakers are concerned with the recent volatility and willing to step in. On that note, it’s worth noting that the PBOC had previously preferred to act over the weekend, when businesses and traders would have time to digest the move before the start of a new week; Tuesday’s midweek move may therefore carry more weight and help reassure jittery traders.
…So what’s next for US stocks?
As of writing, the PBOC’s actions appears to have stabilized sentiment in equity markets. Most European markets closed higher by about 4% on the day, while US markets were trading up by 2%-3% in afternoon trade. That said, Monday’s big drop did plenty of technical and psychological damage, so it’s important to take a step back and evaluate where we stand now.
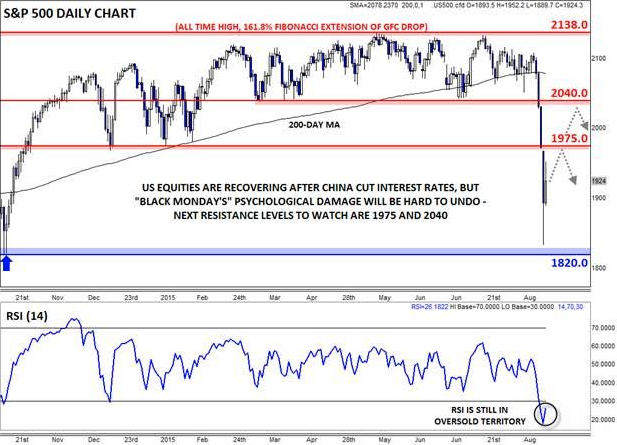
Looking at the S&P 500, US-domiciled equities have regained the 1900 level, but still remain nearly 10% off the all-time highs above 2130, a level we tested just five weeks ago. The market consolidated in an extremely tight 1975-2140 range for the last 10 months, so there is plenty of overhead supply that could cap any near-term rallies. In other words, any traders who bought the S&P 500 in the last 10 months -- and is still holding -- are underwater on their position. As a result, they may be anxious to sell on any rallies back toward the previous consolidation zone.
For its part, the RSI indicator remains in oversold territory, so Tuesday’s bounce could easily extend further this week. Nonetheless, the damage has been done and the medium-term bias will remain bearish as long as the S&P 500 remains below the previous-support-turned-resistance levels at 1975 and 2040. Only a break back above 2040 would start to alleviate the deep psychological scars that traders have suffered over the last week.

Source: FOREX.com
