Markets are now excluding a Fed rate hike for March as inflation is clearly not picking up despite low unemployment rates. 2015 CPI is stalling at 0.7% y/y, far away from the Fed’s target of 2%. A rate hike in April seems also very unlikely with a raised likelihood of 4%. The dollar is weakening as a result of these expectations. Janet Yellen will speak this afternoon in front of the congress to deliver the Fed’s semi-annual Monetary Policy Report. She will later answer questions from lawmakers.
Any answer regarding the state of the U.S. economy will be closely followed by markets. We do not believe in a twist where Yellen would say that no rate hike will happen this year. Confidence in the Fed to achieve its dual mandate (price stability and full employment) is crucial. Stocks markets would suffer from such a situation. It would send the signal that the Fed is in not in control of the situation. We expect to hear a more patient Yellen and the Chinese slowdown and the lingering low oil prices will certainly be good reasons that would justify this downturn.
As a result, we think that Yellen’s comments on the U.S. economy will be positive and hiking rate this year will be kept on hold, for the time being. Consequently, we will be expecting to see a temporary surge of the dollar against the single currency. However, European uncertainties are not over, so pressures on the EUR/USD will still remain bearish over the medium-term.
Crude remains weak, Norges will cut
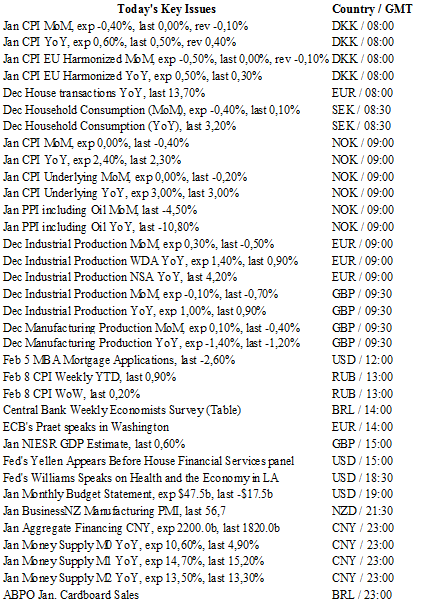
Crude oil rebound off the 12-year low (wti $27.78) after falling sharply nearly 8% on Tuesday. The positive catalyst was news that Iran had indicated that they would be willing to work with Saudi Arabia on production limits. However, markets remain sceptical of this or any coordinated production cuts. There seems to be no relief on selling pressure in sight as the US government released a report indicating that demand will remain soft by lower demand growth forecasts. In addition, the Paris-based International Energy Agency (IEA) warned that supply glut would continue through 2016 as productions cuts have been made at a slower pace than forecasts. The American Petroleum Institute (API) reported a build of 2.4m barrels in US crude stockpiles, lower than the expected 3.6m barrels expected but still a large surplus. As incoming global data suggests a deeper then expected demand growth slowdown further downside and increase volatility should be anticipated. NOK was able to benefit from the higher than expected inflation read despite growth worries due to weak oil prices suggest a Norges Banks rate cut. The CPI increased by 0.6% m/m in January against 0.0 expected (y/y to 3.0% from 2.4). The core rates of inflation remain unchanged at 3% y/y in January. Inflation is now above the banks 2.5% target, weak growth data will push committee member to act on March 17th. USD/NOK traded down to 8.5239 after the inflation release.
EUR/CHF - Continued Reversal.


The Risk Today
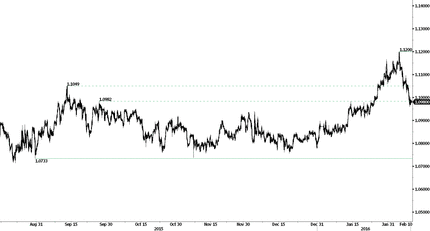
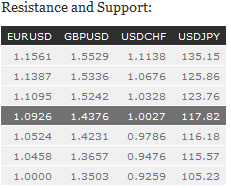
EUR/USD keeps on pushing higher. Daily resistance lies at 1.1387 (20/11/2015 high). Hourly support may be found at 1.0711 (05/01/2016 low). Yet, expected to show further increase. In the longer term, the technical structure favours a bearish bias as long as resistance holds. Key resistance is located region at 1.1453 (range high) and 1.1640 (11/11/2005 low) is likely to cap any price appreciation. The current technical deteriorations favours a gradual decline towards the support at 1.0504 (21/03/2003 low).
GBP/USD's short-term momentum is still lively. Hourly resistance can be found at 1.4668 (08/02/2016 high). Hourly support can be found at 1.4081 (21/01/2015 low). The technical structure looks very positive. Expected to show further increase. The long-term technical pattern is negative and favours a further decline towards the key support at 1.3503 (23/01/2009 low), as long as prices remain below the resistance at 1.5340/64 (04/11/2015 low see also the 200 day moving average). However, the general oversold conditions and the recent pick-up in buying interest pave the way for a rebound.
USD/JPY is declining. Hourly resistance lies can be found at 123.76 (18/11/2015 high). There is no hourly support for the time being. The road is wide open for further decline. The strong support at 115.57 (16/12/2014 low) has been broken. We start favouring a long-term bearish bias. A gradual rise towards the major resistance at 135.15 (01/02/2002 high) seems now less likely. Another key support can be found at 105.23 (15/10/2014 low).
USD/CHF is definitely back to bearish. Hourly support at 0.9786 (14/12/2015 low) has been broken and hourly resistance can be found at 1.0328 (27/11/2015 high). Expected to show continued decline. In the long-term, the pair has broken resistance at 0.9448 suggesting further uptrend. Key support can be found 0.8986 (30/01/2015 low). The technical structure favours a long term bullish bias.

