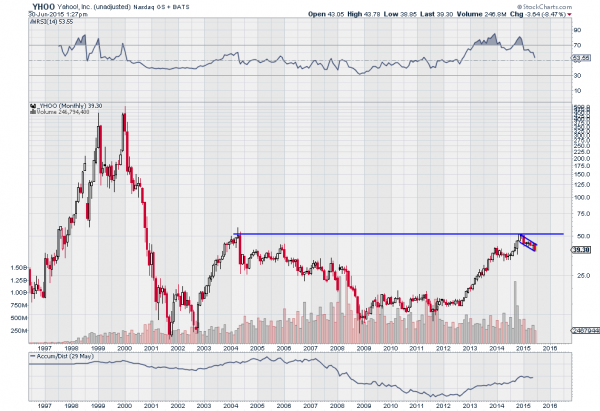
Back in December 2014, I picked Yahoo (NASDAQ:YHOO) as my long term stock pick of the year. At the time, it was technically ready to break above a 10 year high into a lot of free space, and it was caught up in the battle for valuation between zero (or negative ex- their Alibaba (NYSE:BABA) stake) and genius valuations.
Well, you can see from the chart below of monthly price action that it has not panned out. In fact, it is down over 20%.
In my personal account, I have long since stopped out of the position. That is the value of real life over a contest. I can set my maximum risk and then cut my losses when it gets to them. You should have a plan like that too. In fact, with a 5% risk tolerance against the full list of 10 names, you would be in 6th place with a 5% loss.

Yahoo is a great example for the pros and cons of technical analysis. In December, it had a great set up and even started to trigger. But the failure is probably the most important part of the technical picture. I often say that technical analysis is about points of reflection, not points of inflection. That means it is about possibility, not certainty. A possible road map.
And this road map clearly had a wrong turn. This is why technical analysts are also known as risk managers. They look for possible trades and investments, but have a focus on how to mitigate any risk BEFORE they trade. For me, that was the stop loss.
A second point about technical analysis is that it is much better at helping determine price potential than it is about the timing. The chart of Yahoo actually still looks very good. Technically, it has pulled back from a bigger Cup and is forming the Handle of that pattern. As long as the price stays over 31, the Cup and Handle pattern would set a target to the upside of about 90. This just adds to the list of positives technically.
The price action this year can also be viewed as a Bullish Flag. The momentum indicator, RSI, remains over 50 and bullish, and the accumulation/distribution statistic has stalled in its rise, but is not reversing. Personally, I might give up watching it if it falls below the early 2014 base around 34. But the potential is still there. Stock of the Year 2016? 2017? 2018?
Disclaimer: The information in this blog post represents my own opinions and does not contain a recommendation for any particular security or investment. I or my affiliates may hold positions or other interests in securities mentioned in the Blog. Please see my Disclaimer page for my full disclaimer.
