Yesterday's North American trading session was simply a celebration of US domination as the USD has returned to the ‘King Dollar’ throne (at least for a day) and US equity markets had one of their best days in recent weeks. In addition, commodities like gold and oil declined and are threatening to fall even further if certain dynamics play out, but more on that in a minute.
Helping the US-centric celebration were data releases that were extremely encouraging including Personal Income that increased 0.4% on expectations of only 0.3%, and Pending Home Sales which surged 3.1% when only 0.5% was anticipated. The only bit of bad news was that Personal Spending only increased 0.1% when the consensus expected 0.3%, but that seemed to factor very lightly as the markets powered higher.
As for commodities, well, oil is the one that could be making a lot of noise in the coming months. One of the main reasons for this is that the Iranian nuclear deal could be very close to being complete. An agreement between western powers and Iran would theoretically lift embargoes on a variety of Iranian products, including oil, which would then flood an already overstocked market. With the US’s increased production of the product and OPEC’s unwillingness to decrease production, the world is quickly becoming saturated. There are even reports that the US is running out of room in storage tanks to put all the excess crude, which is depressing prices even further. An explosion of additional production from Iran could cause prices to fall even further.
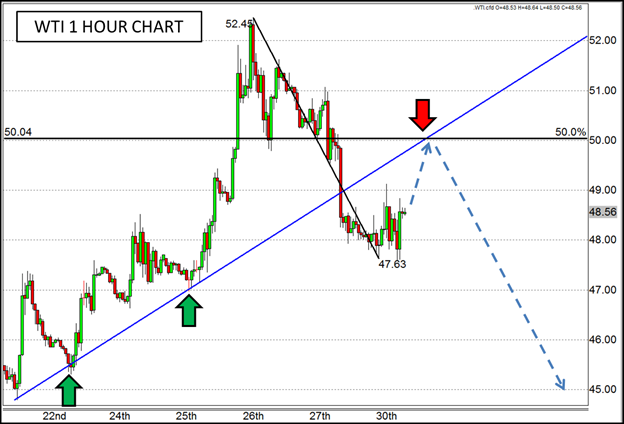
Strangely enough, the Iranian Oil Flood was one of the predicted Top Tail Risks for 2015 that we forecasted back in December in our 2015 Market Outlook. While that guide predicted that WTI would fall down to $40 (it was near $80 at the time), that prediction seems rather conservative considering WTI has already nearly touched $42, a few weeks ago. The volatile mix of increased production and nary a place to put it could make oil fall to bargain basement prices which could be $20 or below. Before it gets there though, we may see another run at the $50 level where there are a couple of resistance levels with which to contend.
The most recent drop in prices from last week to yesterday broke through a rising trend line that had developed after the Federal Reserve meeting, and what used to be support could now act as resistance. In addition, the 50% Fibonacci retracement from the March 26th high to yesterday’s low is right at the $50 level. And finally, the $50 level may act as a psychological level of resistance that could push the commodity lower as the Iranian rumors start making more of an impact. If all of these factors combine over the next 24-48 hours, WTI might rise to $50, but that may be the end of the rally as the path of least resistance appears to be to the downside.

