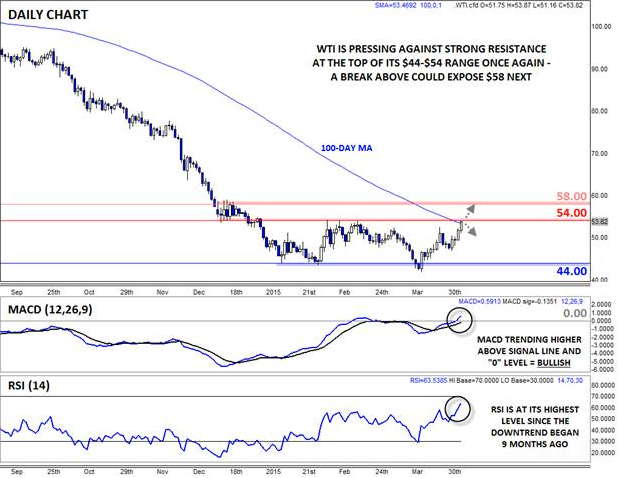
More than two months ago, we commented on oil’s stealth “bull market” and concluded that, “a rejection at 53.50 would point toward more consolidation around 50.00 in the short term, though the staggering scope of the rally suggests it’s unlikely that oil will resume its previous downtrend at the same pace any time soon.” As it turns out, the same $10 range from roughly $44 to $54, has now held for more than a quarter of a year, though the 14% rally over the last four days has put that range in jeopardy.
From a fundamental perspective, there are a couple of bullish catalysts driving oil higher:
1) A Pause in the Dollar Uptrend
A big component of the recent weakness in oil prices has been the strength in the dollar. With the dollar index pausing below the psychologically-significant 100.00 level over the last month or so, the supply and demand in the global oil market have been driving trade. A breakdown below 50-day MA support at 96.00 in the dollar index could prompt a bullish breakout above 54.00 in WTI.
2) Delayed Expectations of New Supply from Iran
On Friday, the US and Iran agreed to the framework for a nuclear deal that could lead to more oil exports from Iran. While this could eventually serve as a headwind for oil prices, it’s important to note that there are still logistical hurdles to approving the deal, and even then, it would still take upwards of a year for Iran to create the infrastructure to start exporting large amounts of oil.
3) The Continued Drop in Rig Counts
Finally, we are seeing a clear economic response to the precipitous drop in oil prices. The Baker Hughes (NYSE:BHI) rig count data dropped by 11 rigs to 802 total oil rigs in the US, marking the 17th consecutive weekly decline. Of course, oil companies tend to shut down their least productive rigs first, so much of the US oil production will continue to flow in the short term, but the decrease in supply will eventually push prices back up.
Technical View: WTI
As we noted above, WTI is testing the top of its range at 54.00, a level that also marks the 100-day MA. Given the previous rejections at this key level, bullish traders will remain understandably cautious below $54, but if we see a break and close above that barrier, a move up to the next level of previous resistance at $58 could definitely be in play next. Both the MACD and RSI indicators are at their highest levels since the downtrend began nine months ago, further bolstering the bullish case. Of course, just as we noted two months ago, “a rejection at [54.00] would point toward more consolidation around 50.00 in the short term, though the staggering scope of the rally suggests it’s unlikely that oil will resume its previous downtrend at the same pace any time soon.” In that case, we may have the opportunity to reiterate the same analysis again in another two months!

Source: FOREX.com
For more intraday analysis and market updates, follow us on twitter (@MWellerFX and @FOREXcom)
