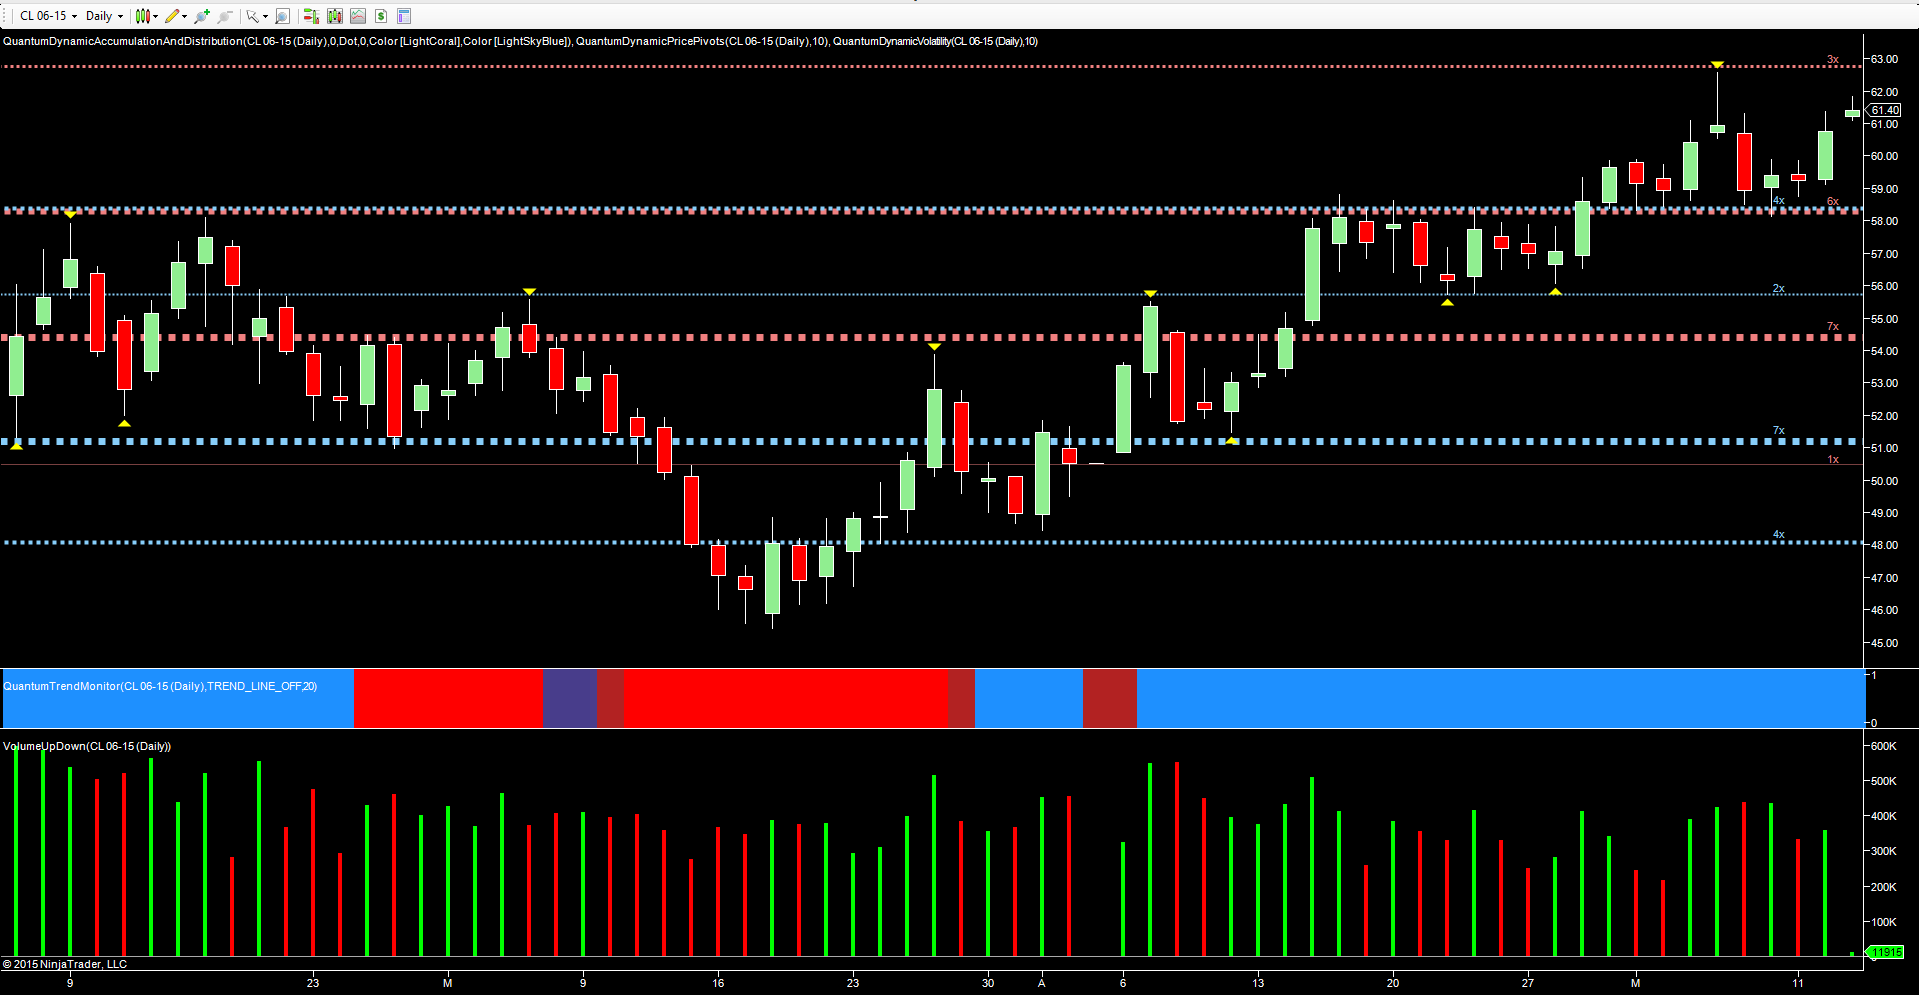
Whilst one swallow does not a summer make, it was another positive day for the price of oil yesterday, with the WTI June futures contract moving firmly through the $60 per barrel level to close at $60.75 per barrel on good volume. This positive tone for crude oil has continued in overnight trading with the futures contract moving through the $61 per barrel region to trade at $61.27 per barrel at time of writing.
From a fundamental perspective it has been an interesting few days, with a variety of factors all being played out in the recent congestion phase that has seen the price of oil build a strong platform of support in the $58.20 per barrel region. This continues to hold firm. Perhaps the most interesting factor has been OPEC’s recent statement saying they believe oil prices will remain below $100 per barrel for the next ten years – a clear statement of intent that their policy of taking on alternative energy suppliers is set to continue.
Partly in response, and partly no doubt to continue its policy of building its own energy pipeline, US authorities have granted drilling rights in the Arctic Ocean to Royal Dutch Shell (NYSE:RDSa), much to the annoyance of the green lobby. The Arctic is forecast to hold approximately 20% of the world’s undiscovered oil and gas reserves, and is in sharp contrast to North sea oil where platforms are increasingly being decommissioned as oil fields become exhausted.
Moreover, the news this week from China of a surprise cut in interest rates also helped to move oil prices higher, and with the US dollar continuing to remain weak and sliding lower, this too has helped to provide further positive sentiment for oil. Finally, today sees the latest round of weekly oil inventories from the Cushing hub, with last week’s draw finally reversing the long-term build in supply and coming in at -3.9mbbls. Today’s forecast is for a more modest draw at -0.1mbbls. Provided we do not see a return to the build side of the equation, this should help to further cement the bullish tone at present.
Finally to the daily chart, where the regions of resistance and support are now clearly defined. The ceiling of resistance is firmly in place in the $62.70 per barrel region, which was tested last week with the shooting star candle of the 6th May and duly topped with a pivot high. However, for any continuation of the current bullish trend, this level now needs to be breached. Provided the move through is accompanied on high volume, the bullish trend for oil is likely to continue through the $63 per barrel and beyond.

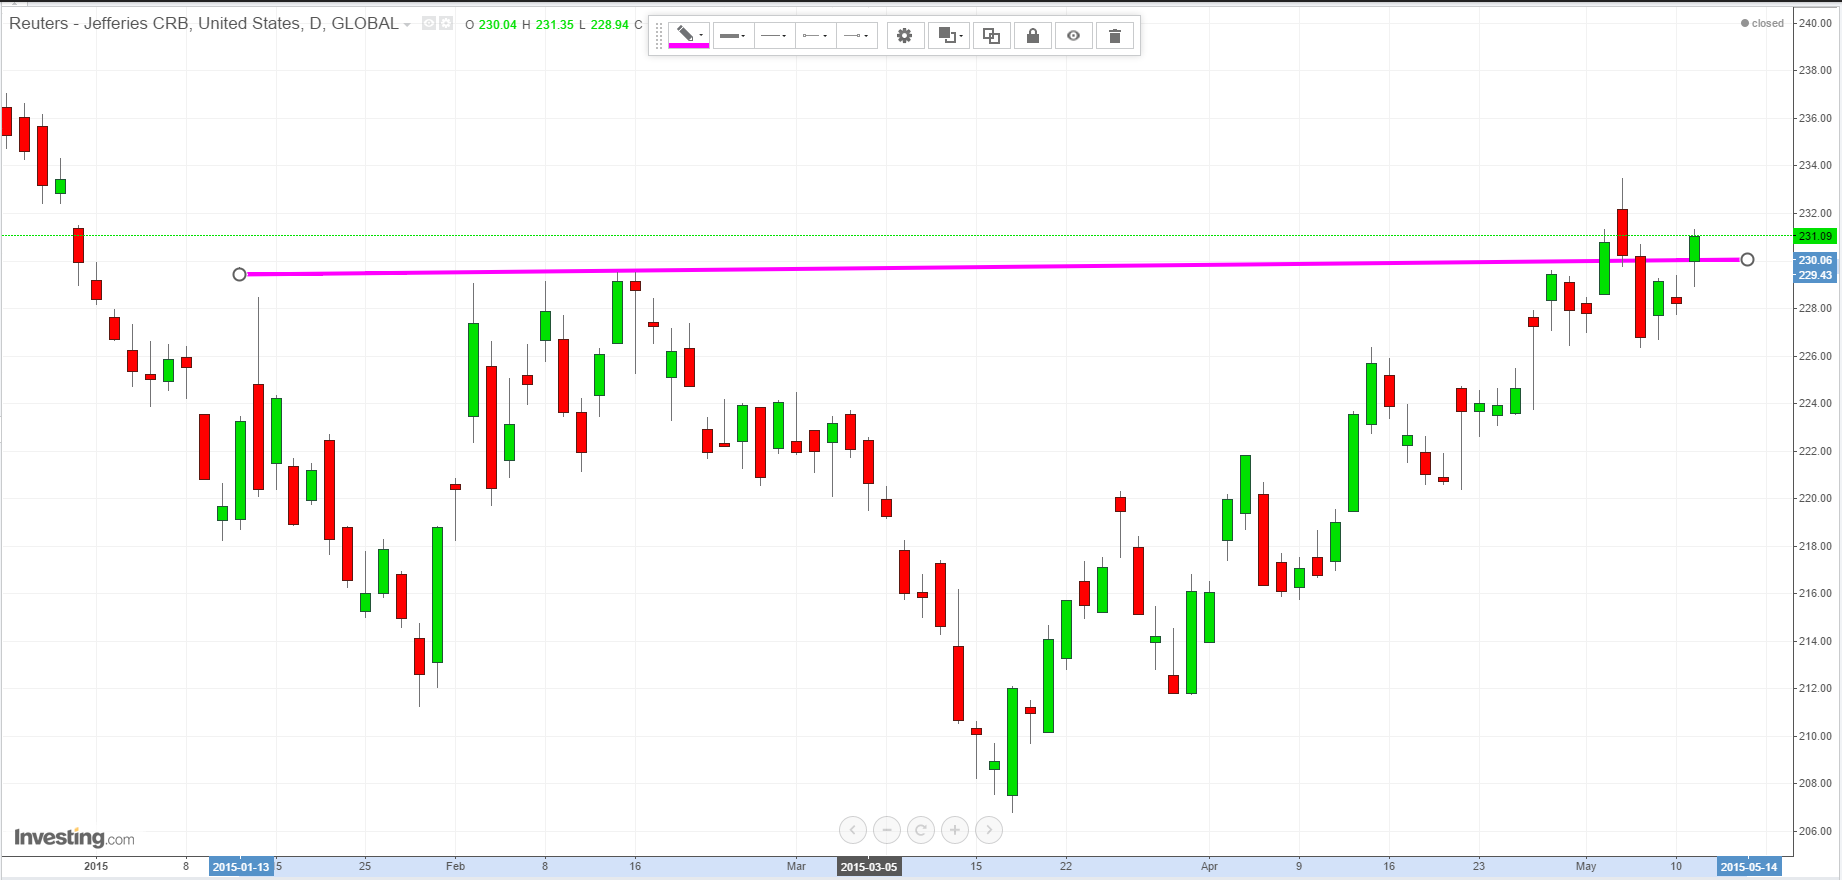
The Trend Monitor at the bottom of the chart at top continues to confirm the bullish picture on the daily chart, and with the CRB index now breaking above the 230 region on a strong platform of support, the outlook for commodities and oil continues to remain positive.
However, longer term, much will depend on the direction of the US dollar. Should interest rates rise sooner rather than later, this could reverse these recent gains, and we will see oil prices move lower once again.
