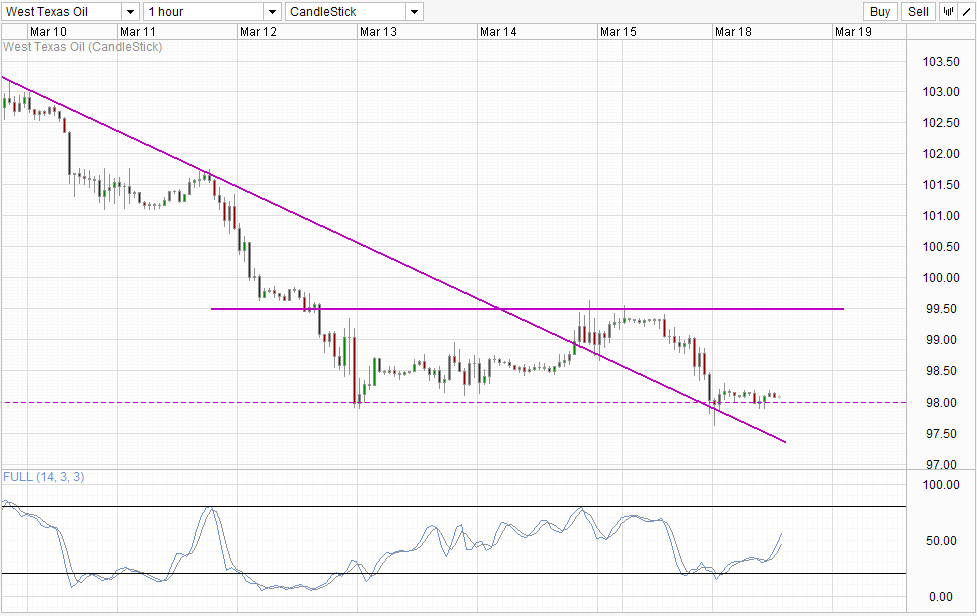
The slide in Crude Oil continues as the threat of war between Russia and Ukraine became a little bit more remote. However, bearish momentum seemed to have stopped with WTI Crude staying stable above 98.0. Considering that broad risk appetite is highly positive right now, it is not unreasonable to see bullish pressure able to prevent further slide. This bullish pressure was also aided by stronger than expected US factory data yesterday.
The higher than expected Industrial Production suggest that demand for Crude Oil within the States will stay healthy, and is a nice encouragement which address the oversupply issue in US that has been plaguing WTI prices in the past few years. To fully appreciate this impact, one would only need to look at counterpart Brent Crude that slide down much more aggressively yesterday, with prices continuing to decline during late US session while WTI Crude has started to rebound slightly post US midday. This does not mean that WTI Crude will be able to climb higher as the lack of war means that energy commodities will be giving back a lot of the "war premiums" earned earlier on. Nonetheless, we can expect Brent/WTI premium to narrow should US factory data continue to outperform European/Global counterpart.
Hourly Chart
From a pure technical perspective, it is hard to imagine WTI being bullish, echoing what is mentioned earlier. Even though we are staying above 98.0 for now, Stochastic readings tell us that we're already within a bullish cycle phase. As such, it is clear that bullish momentum remains extremely weak and a break of 98.0 in search of descending trendline should not be too surprising. Nonetheless, should prices manage to climb up higher from here out and breach 98.5 soft resistance, a case could be made for a move towards 99.5 once again but likelihood of extended push beyond 99.5 is highly unlikely.
Daily Chart
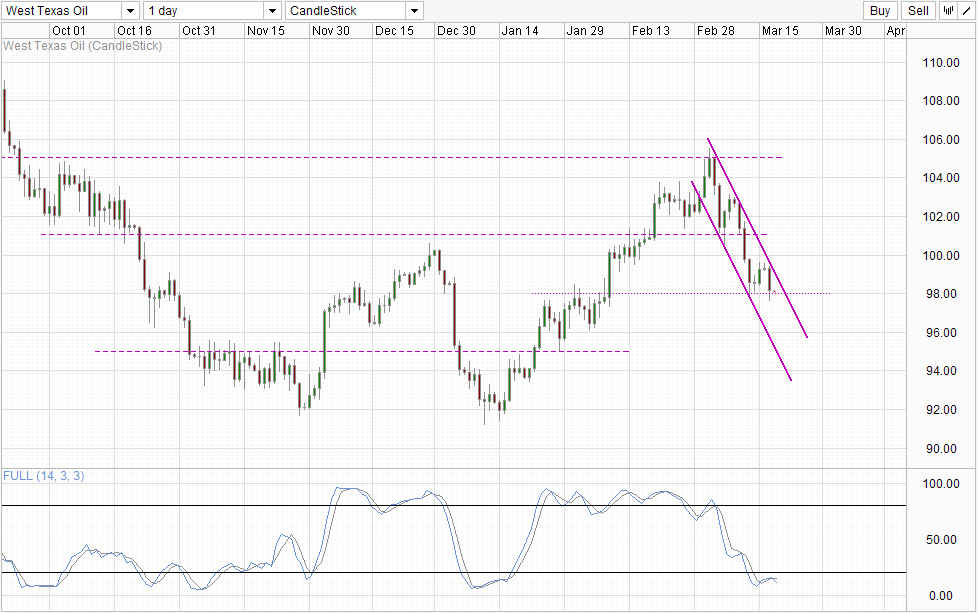
Daily Chart suggest that bearish potential is huge. Should 98.0 gets broken we could easily see current bearish trend extended all the way to Channel Bottom which is currently below 96.0 and closer to 94.0. However, that is assuming that prices will experience a sharp sell-off. Instead, we could also see prices slowly descend below 98.0 straddling along Channel Top.
Fundamentally, with the weather clearing up, the need for Crude for heating purposes will decrease. But we should also note that industrial activities will start to climb higher as well as the improved weather allows for longer working hours and easier commute. Hence, the fundamental outlook for Crude Oil in the next 1-2 month or so is not clear cut and this would also mean that sensitivity to DOE numbers will be heightened. In the meantime, there isn't any strong evidence or reason for any price reversal and hence bears may continue to enjoy free reign for 1 more day before DOE report tomorrow.


