STOCKS:
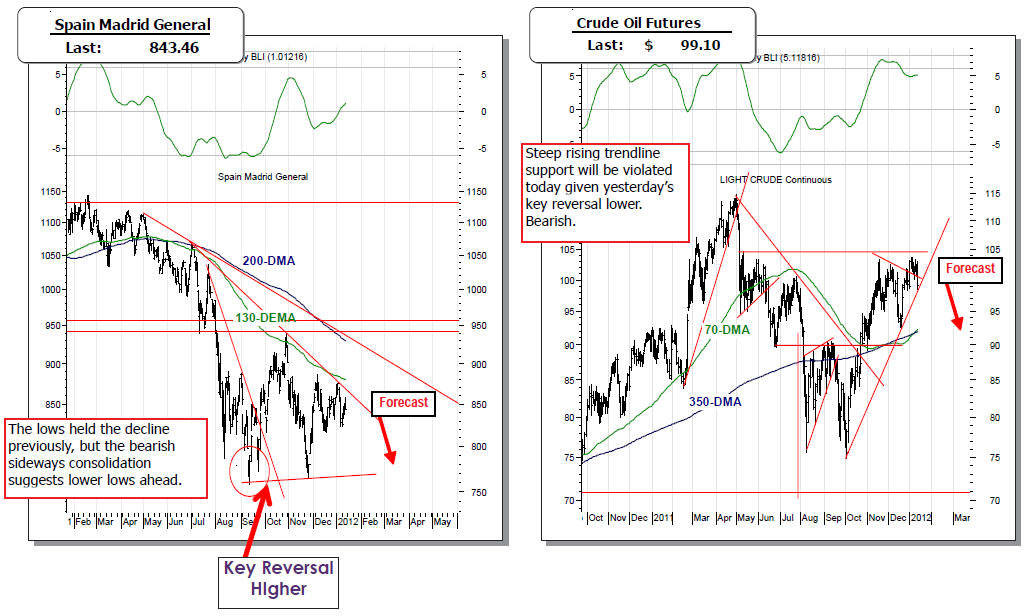
As 2012 begins, very little has changed from the end of 2011: the European debt contagion remains in place and is growing, China remains on a growth deceleration curve — while the US is showing stable, albeit it very low growth. What is clear to us, is that at this point — the US is better positioned than the rest of the world, which simply means that it shall outperform yet again this year.
STRATEGY: Technically speaking, the S&P 500 remains above longterm support at the 45-mema at 1190; which is critical given it delineates bull & bear markets. Now, given we are 5-trading days into the New Year, we’ve witnessed lackluster trade on what has in past cycles been a very volatile period. The nascent 2012 rally is technically weak, and therefore suspect. Rallies are to be sold.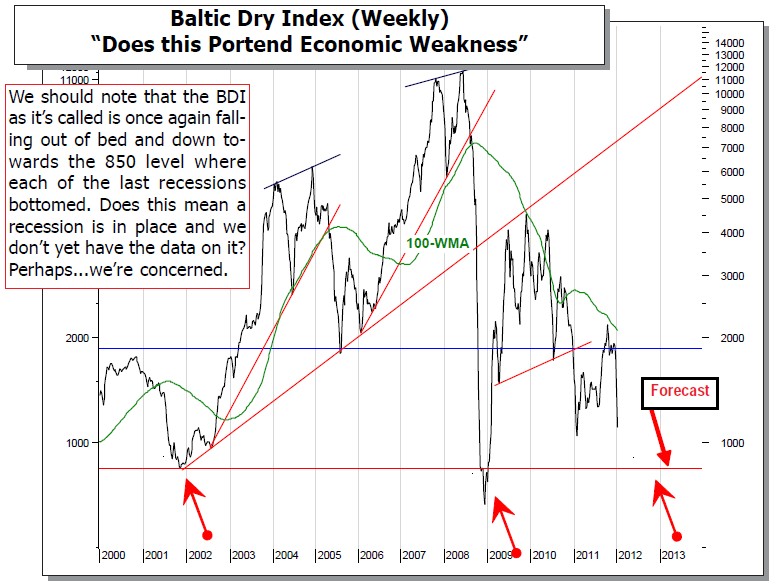
WORLD MAREKTS ARE “MIXED” AGAIN and it all stems from the difference in the news cycle from Asia to Europe – with Europe being the driver of everything. The major “rumor du jour” is that S&P’s credit rating agency is set to downgrade several Eurozone countries today…but not Germany. The source is a senior Eurozone government official, and the credit rating agencies generally give 24-48 hours’ notice of doing so…we believe the rumor. Also of note: Italy was able to auction off €4.5 billion euros at 4.83% vs. the previous 5.62%. This was considered very well; but demand was much lower than it was for the Spanish auction yesterday. We are still very worried, for this was a 3-year auction; it’s the 10-year auctions that we are most concern about…especially given the tepid bid-to-cover on the 3-year.
Quite obviously, this has pressured the European bourses from decent gains to losses.
TRADING STRATEGY: We are long Volatility (VXX), and are so given the myriad of negative fundamental and positive technical reasons. Today, we included a short S&P position in the portfolio via SDS as we are attempting to give our readers a good sense of our managed accounts. And since SDS has been a position in our managed accounts since before the year began, we thought it wise and helpful to go ahead and include SDS where it closed on December 31.
We shall look to add to our positions in the days ahead, and we’ll consider an S&P breakdown below 1265 as being sufficient at this point to perhaps add another 25% short position…most likely in the Russell 2000 small caps (IWM:TWM).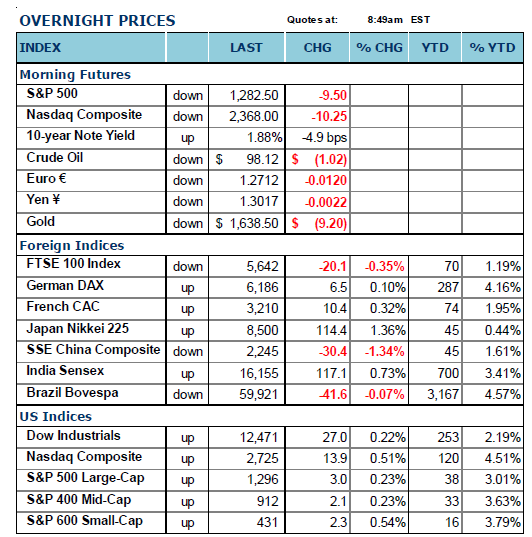
MAJOR MARKET FUTURES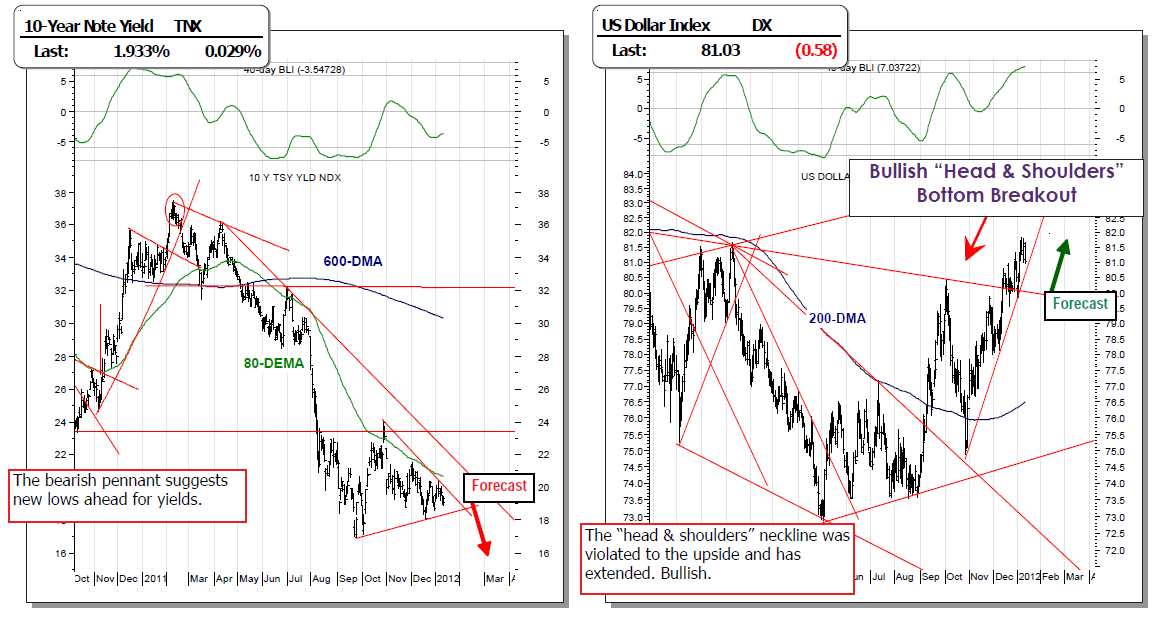
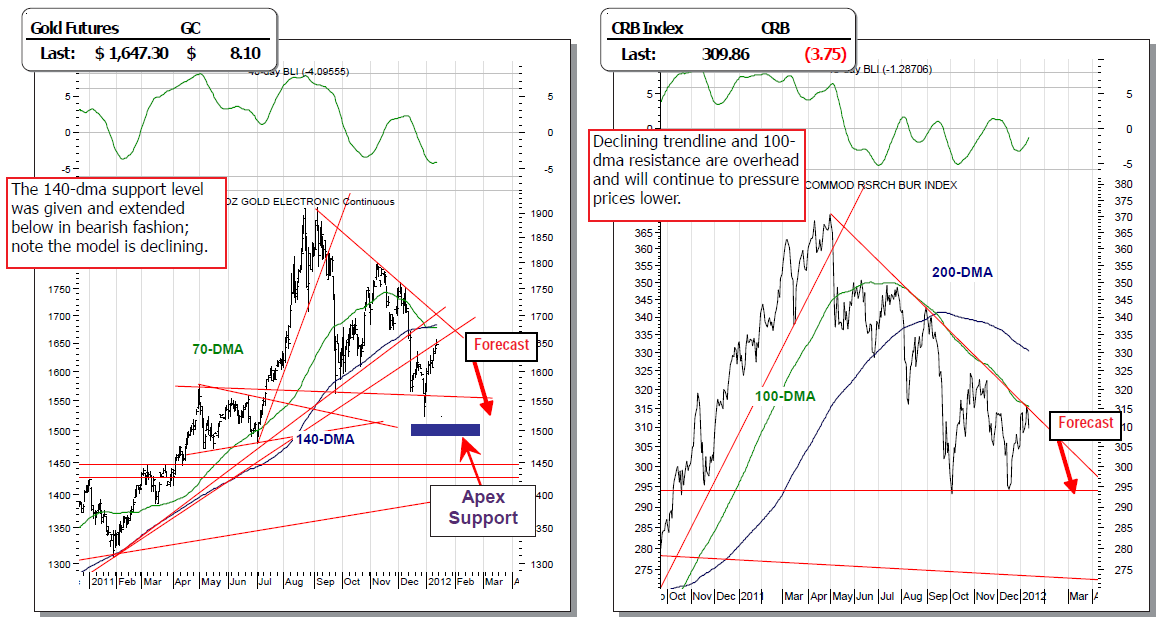
MAJOR WORLD RISK POINTS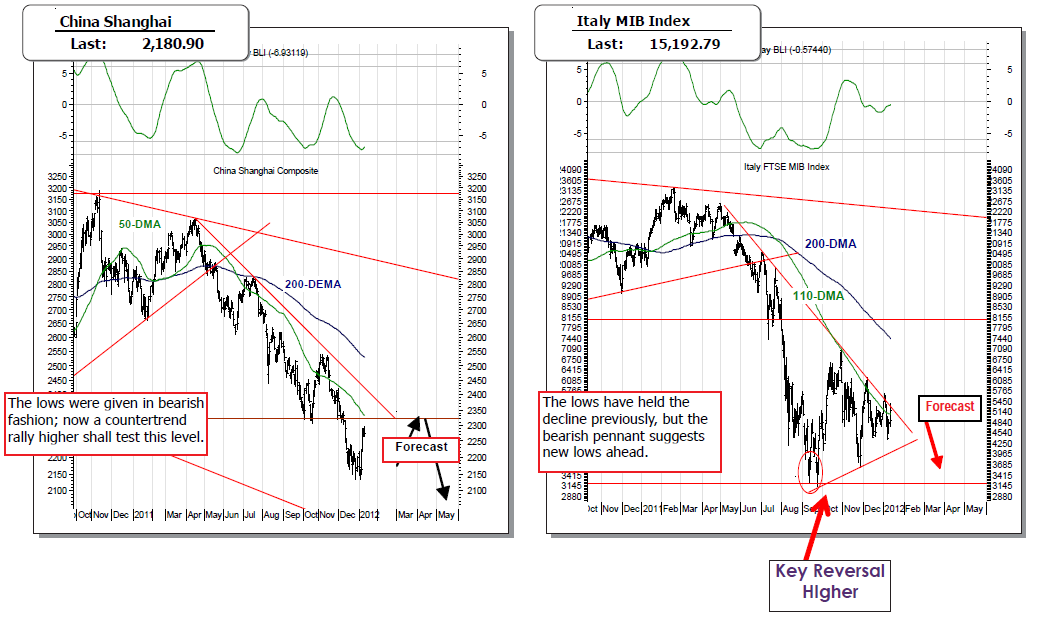
S&P 500 INDEX — TECHNICAL COMMENTS
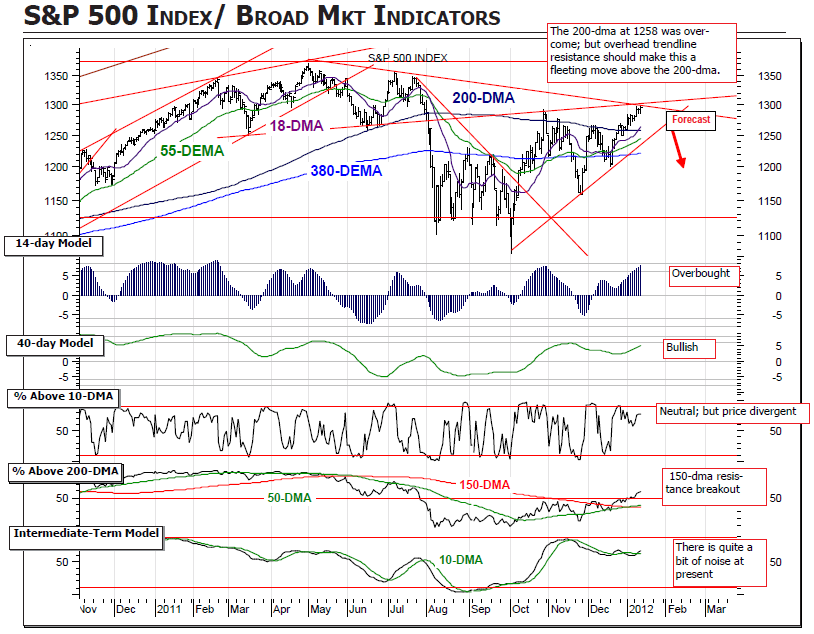
THE TECHNICAL PICTURE IS AT A VERY CRITICAL POINT The S&P bullish key monthly reversal to the upside remains in place — which stands important given the important 55-dema/380-dema levels at 1220 were regained. Now, the bulls have pushed prices higher above the 200-day moving average at 1258, but on diminished volume and more importantly...prices have rallied in a rather selective manner. This is generally bearish.
Moreover, several major overhead trendline resistance levels cross between 1280 to 1300; which given the divergence between prices and the % of stocks above their 10- day — suggest downside pressure should come to the fore. We are willing to add to short portfolio positions on a breakdown of the 1265 level.
TECHNICAL INDICATOR REVIEW:
The 14-day is now at overbought levels, while the 40-day ir rising in modest fashion.
The % of stocks above their 10-day moving average shows a major negative divegence with prices — indicating selectiveness..
The % of stocks above their 200-day moving average stands at 58%...up +1% from the prior close. The 150-dma was violated to the upside in bullish fashion...a positive.
The Intermediate-term Model is once again testing its 10-dma; still, it is far off its previous highs.
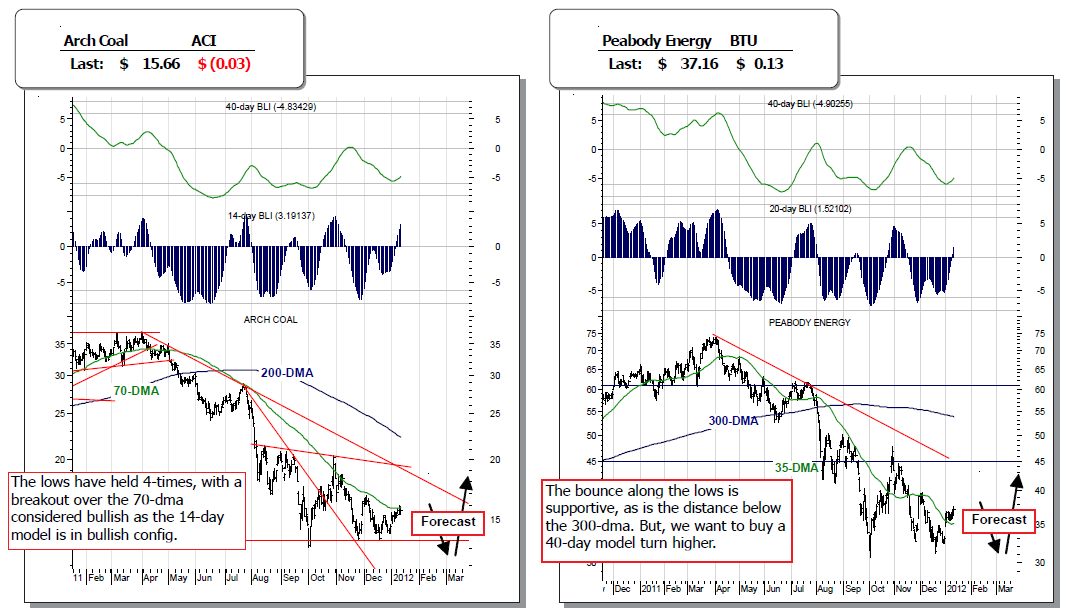
STOCKWATCH – POTENTIAL LONGS I
STOCKWATCH – POTENTIAL LONGS II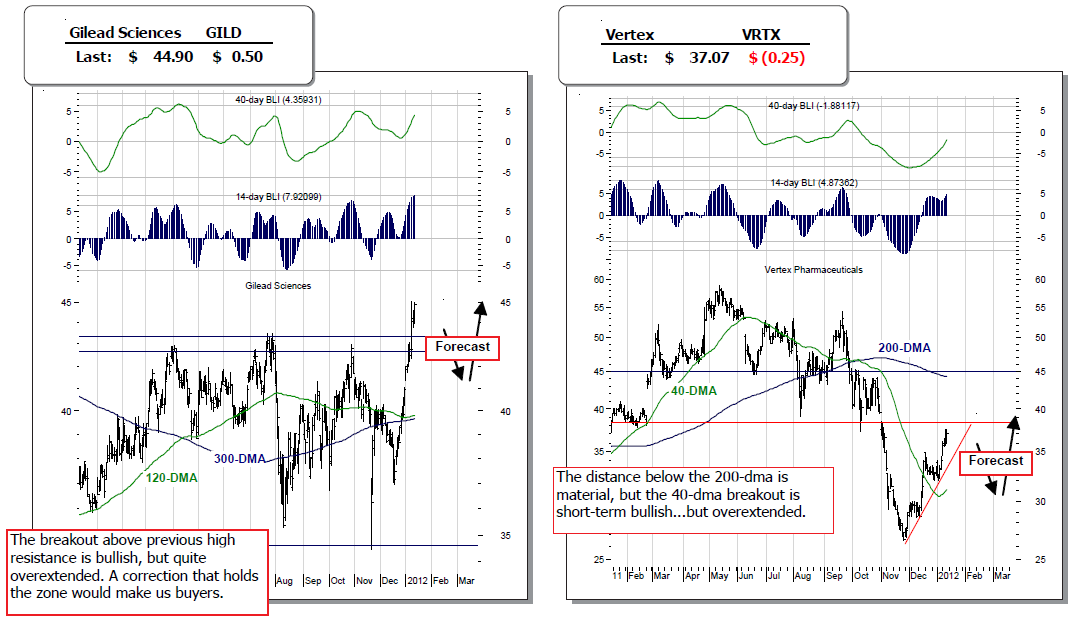
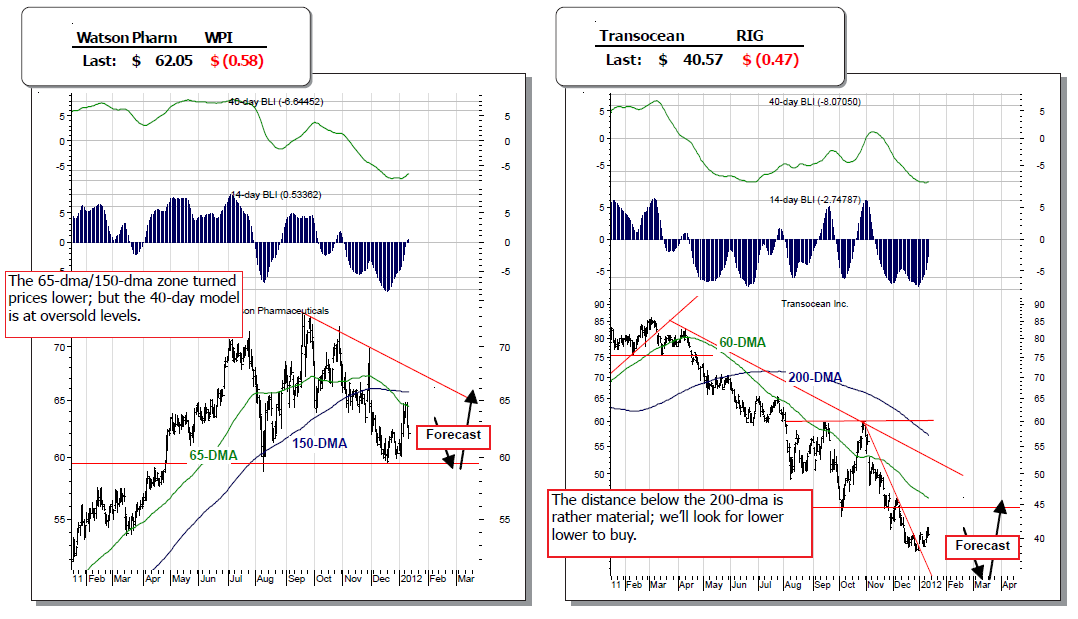
STOCKWATCH – POTENTIAL SHORTS I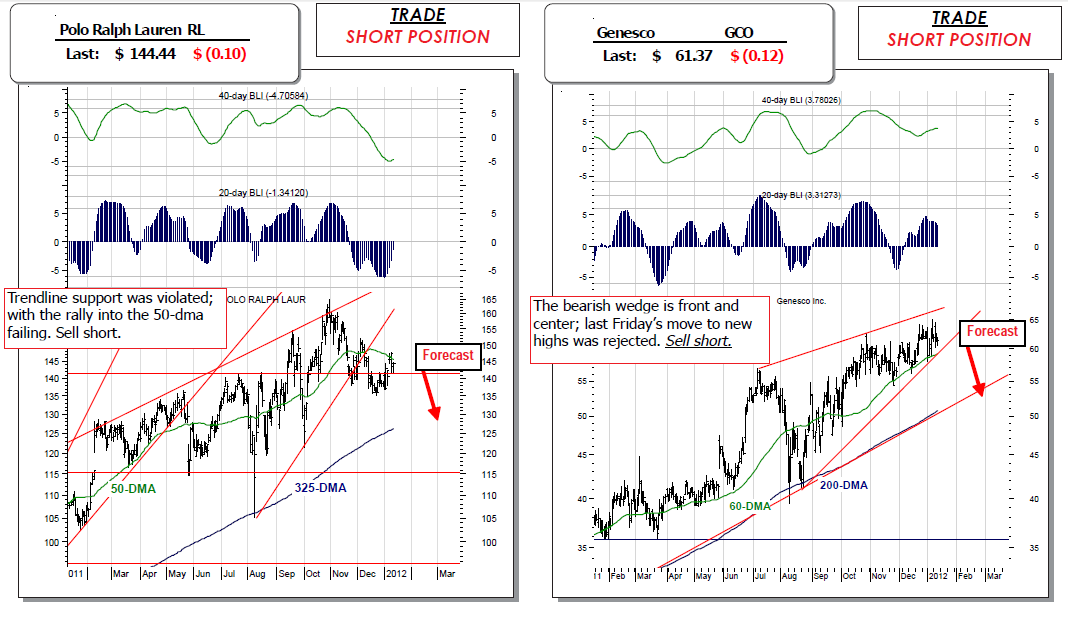
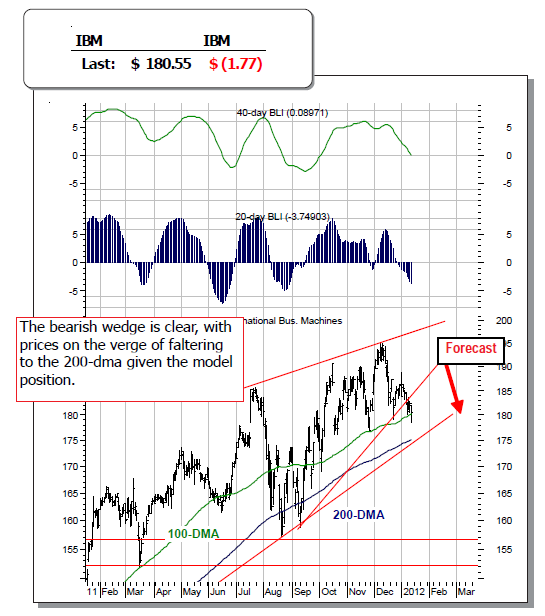
SHORT POSITIONS I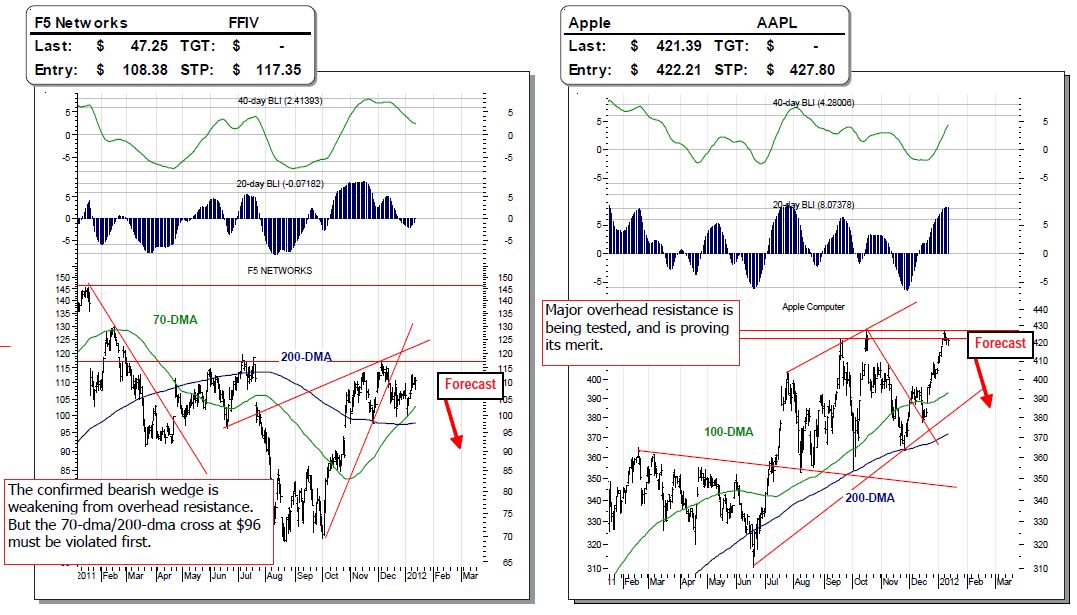
To read the entire report please click on the pdf file below.
