A decentralized marketplace for precious metals and bitcoin traders has been introduced by DigitalTangible. The unique innovation of this exchange is that it allows investors to seamlessly move between Bitcoin (BTC-eUSD) and Gold, as tokens representing physical gold bullion are attached to Bitcoin addresses. This development should entice more ‘gold bugs’ into Bitcoin and increase the exposure and adoption of the crypto-currency among precious metals investors. This service aims to fill the gap in the market to better accommodate the needs of investors.
Also, to increase awareness and possibly adoption of Bitcoin, Coin Academy has launched an online education course to educate Bitcoin novices about the technicalities involved in all things Bitcoin, suitable for novices and experts. It will also include information on alternative crypto currencies such as Litecoin and Dogecoin. This content is free and is part of a trend of an increasing number of educational courses on Bitcoin. For example, the University of Nicosia introduced a free massive open online course for an introduction to Bitcoin earlier this year and several online ‘academies’ offer free courses.
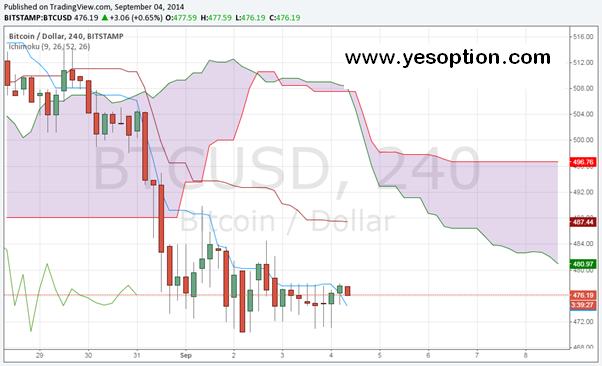
After a minor downward trend yesterday, the Bitcoin price seems set to reverse and establish an upward trend. A Hammer candlestick at the 4 hour time frame which has formed after this downtrend indicates a possible reversal. The past 24 hours has seen a 0.59% price increase amidst positive fundamental news in the past 48 hours.
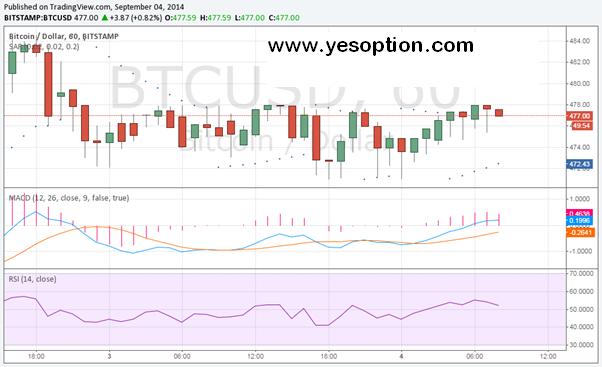
Moving on to technical analysis, the hourly chart below shows an upward trend was established earlier this morning. The MACD is indicating overbought conditions as the faster moving average is quite far away from the slower moving average and the faster blue line is approaching the negative zone. The relative strength index is also decreases and a move below 50 will confirm a bearish trend.

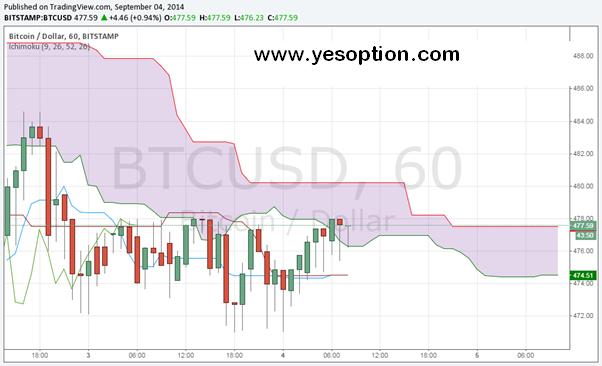
Using the Ichimoku indicator at the hourly time frame, we see that the price action has breached the lower resistance level of the cloud. Further resistance will be encountered at the $480 level. If the price exceeds this level, we could see an upward trend established. The cloud is moving in the downward direction, so that support will be around the $477 level. An upward move of the conversion line above the base line will indicate bullish momentum.

Looking at the 4 hour chart below, it can be seen that the price action is well below the Ichimoku cloud which could suggest that the Bitcoin price has some room to move in the upward direction. The cloud indicates that resistance will be encountered in the $490’s today and the mid-$480’s in the next few days. A move above $487.44 will indicate bullish momentum. If the lower resistance levels of the cloud are broken through, the price may extend to $497.

