The fear trade that’s animating Treasury buying is alive and well. Although you might have missed it by focusing on the soaring US equity market, the rush into safe-haven Treasuries has hardly missed a beat this year — a preference that’s pushed bond prices up and yields down.
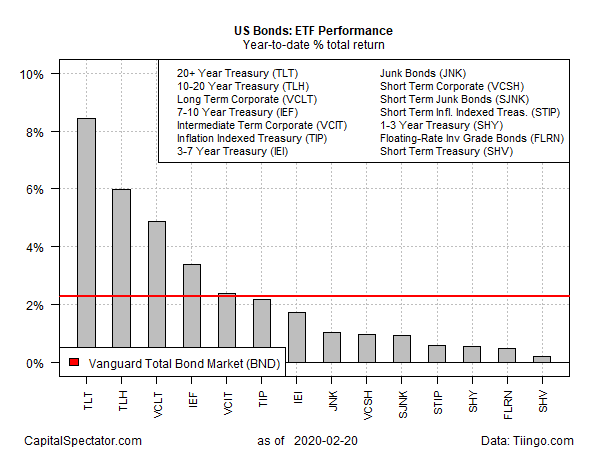
A key theme that stands out so far in 2020: go long and earn big. Using a set of exchange traded funds shows a conspicuous upside gap in long-dated Treasuries vs. the rest of the major corners of the US fixed-income market.

The iShares 20+ Year Treasury Bond (NASDAQ:TLT) has surged more than 8% so far in 2020 through yesterday’s close (Feb. 20). The second-strongest year-to-date return via iShares 10-20 Year Treasury Bond (NYSE:TLH) is well behind with a 6.0% gain. For the rest of the field, there’s no competition to speak of, although every major slice of the bond market is enjoying a rally this year. That includes the US fixed-income benchmark: Vanguard Total Bond Market (NYSE:BND), which is up more than 2%.
Coronavirus risk is on the short list of catalysts that are driving assets into Treasuries. The blowback continues to roil China’s economy and there are emerging signs that infections are spreading throughout Asia at an increasing pace. Notably, South Korea on Thursday reported a surge in cases above 200 for the first time.
“The sudden jump in infections in other parts of Asia, notably in Japan and South Korea, has sparked renewed concerns,” says Khoon Goh, head of Asia research at Australia & New Zealand Banking Group. “This points to a new phase in the outbreak, and one which will see continued disruption and more economic impact than previously thought.”
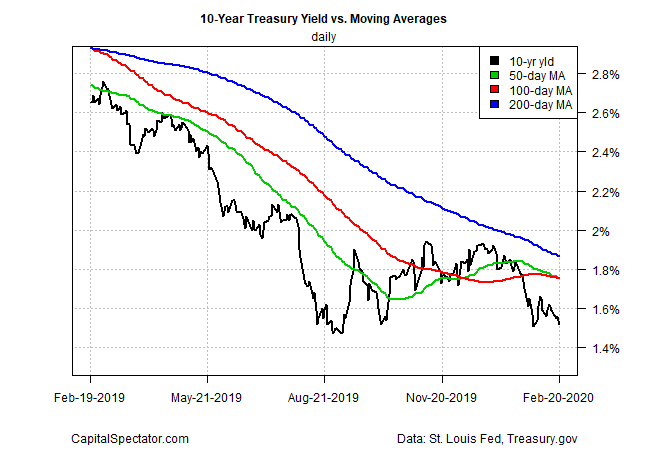
Whatever the reason for the rush into bonds these days, there’s no mistaking the downside bias in yields. The benchmark 10-year Treasury rate, for example, looks poised to slide further. The yield slipped to 1.52% yesterday (Feb. 20), close to last September’s 1.47%, which is just a hair above 2016’s nadir, 1.37% — the lowest point on record (using the 1960s as a starting point). Adding to the expectation that the 10-year yield could continue falling is the downside bias in a set of moving averages for the rate, which imply that the path of least resistance remains down.


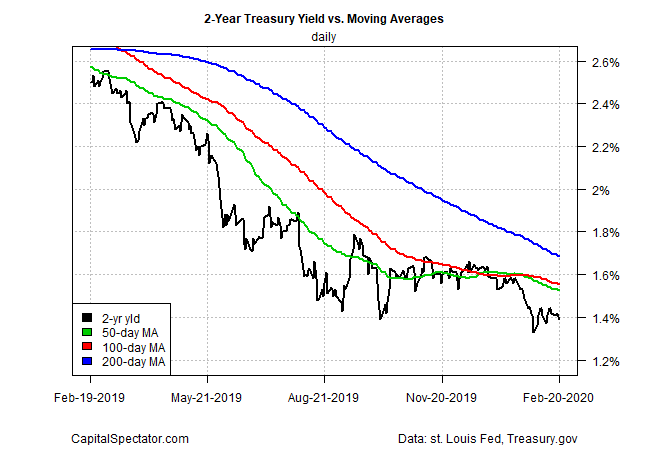
A similar profile applies to the 2-year Treasury yield, which is widely considered the most sensitive spot on the curve for rate expectations.
Is the bond market laying the groundwork for another rate cut from the Federal Reserve? The question was topical on The Capital Spectator earlier this week and Axios picks up the subject, quoting Thomas Simons, money market economist at Jefferies: “If you look at the uncertainty about concerns surrounding coronavirus and the fact that [the Fed] added the phrase ‘for a time’ to describe how long current policy will remain appropriate, those read to me as a signal that a rate cut may be coming.”
Fed funds futures, however, continue to price in low odds that the central bank will cut its target rate (currently at a 1.50%-to-1.75% range) at next month’s FOMC meeting, based on CME data. The crowd is estimating a 90% probability of no change for the March 18th announcement. The no-change estimate falls to a 65% probability for the April 29 meeting and under 50% for the June 10 policy decision.
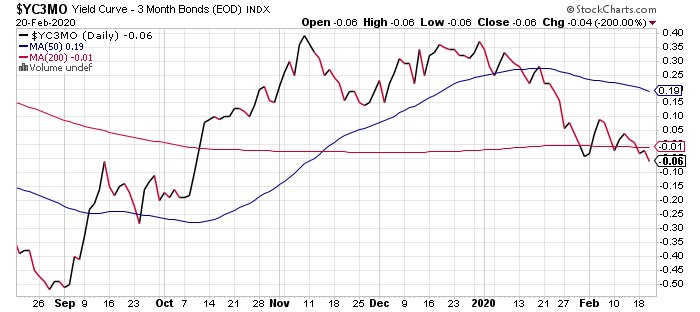
Adding to the pressure for a rate cut is the recent return of the 10-year/3-month Treasury yield spread to sub-zero territory. On Thursday, this widely followed spread slipped a bit deeper into the red at -0.06 basis points – the lowest since October. Assuming the Fed wants to maintain a generally upward sloping curve — the “normal” state of affairs — the recent return of inversion suggests another rate cut is timely.

Yet Federal Reserve Vice Chairman Richard Clarida is pushing back on the rate-cut chatter. Citing strong economic fundamentals for the US, he downplayed the potential for easier policy in the near future in an interview with CNBC yesterday.
Mr. Market, however, is increasingly inclined to disagree. Does that mean that an attitude adjustment is approaching for the Fed? Perhaps not, assuming that the incoming US economic data points to ongoing growth. But there’s a joker in the deck and so the first question is whether coronavirus news in the weeks ahead will upend the central bank’s best-laid plans for maintaining a steady rate policy?
