In recent weeks crude oil came back below the barrier of $50, which triggered declines and resulted in a drop to almost six-month lows. Despite this move, oil bulls pushed the commodity higher, which resulted in an invalidation of the breakdowns under important support levels. What happened at the same time with oil stocks? Will we see higher values of the ARCA Oil in the coming weeks?
Let’s jump right into charts (chart courtesy of http://stockcharts.com) and find out what can we infer from them about future moves.
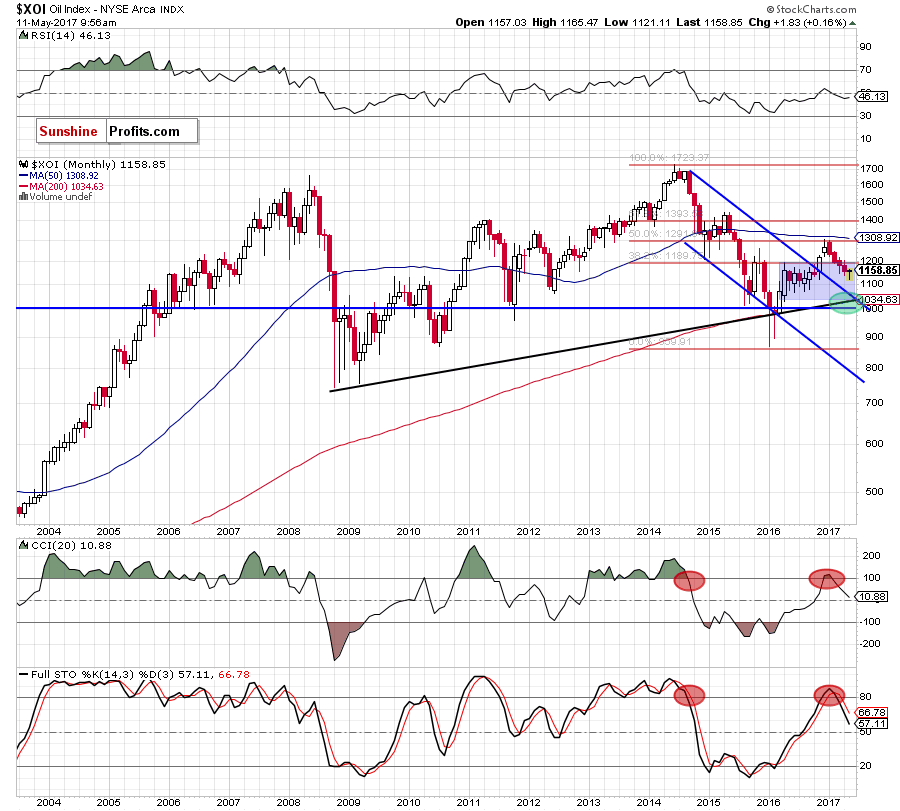
Let’s start today’s article with the long-term chart of oil stocks.

Looking at the long-term chart, we see that the overall situation hasn’t changed much as oil stocks are still trading slightly below the previously-broken upper border of the blue consolidation. Additionally, the sell signals generated by the CCI and the Stochastic Oscillator remain in place, suggesting another attempt to move lower.
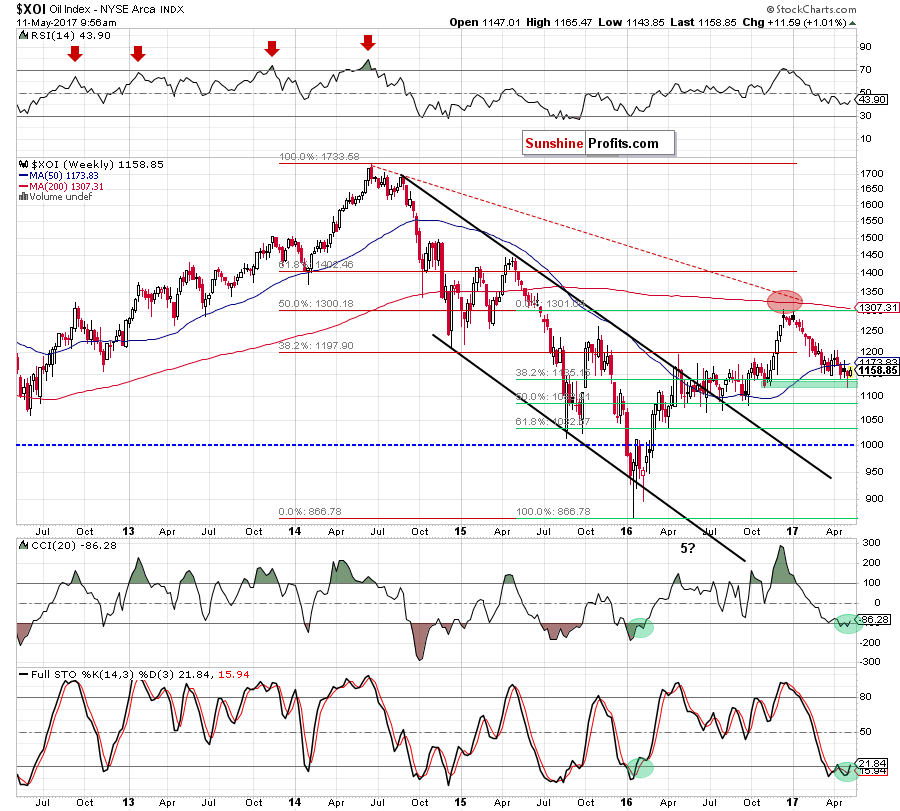
But will we see such price action in the coming weeks? Let’s examine the medium-term chart and find out.

From this perspective, we see that the XOI moved a bit lower in the previous weeks, which resulted in a drop to the green support zone created by the October and November lows. As you see, this area triggered a rebound, which took oil stocks above the previously-broken 38.2% Fibonacci retracement. In this way, the index invalidated the earlier breakdown, which together with the current position of the indicators (the CCI and the Stochastic Oscillator generated buy signals) suggests further improvement in the coming weeks.
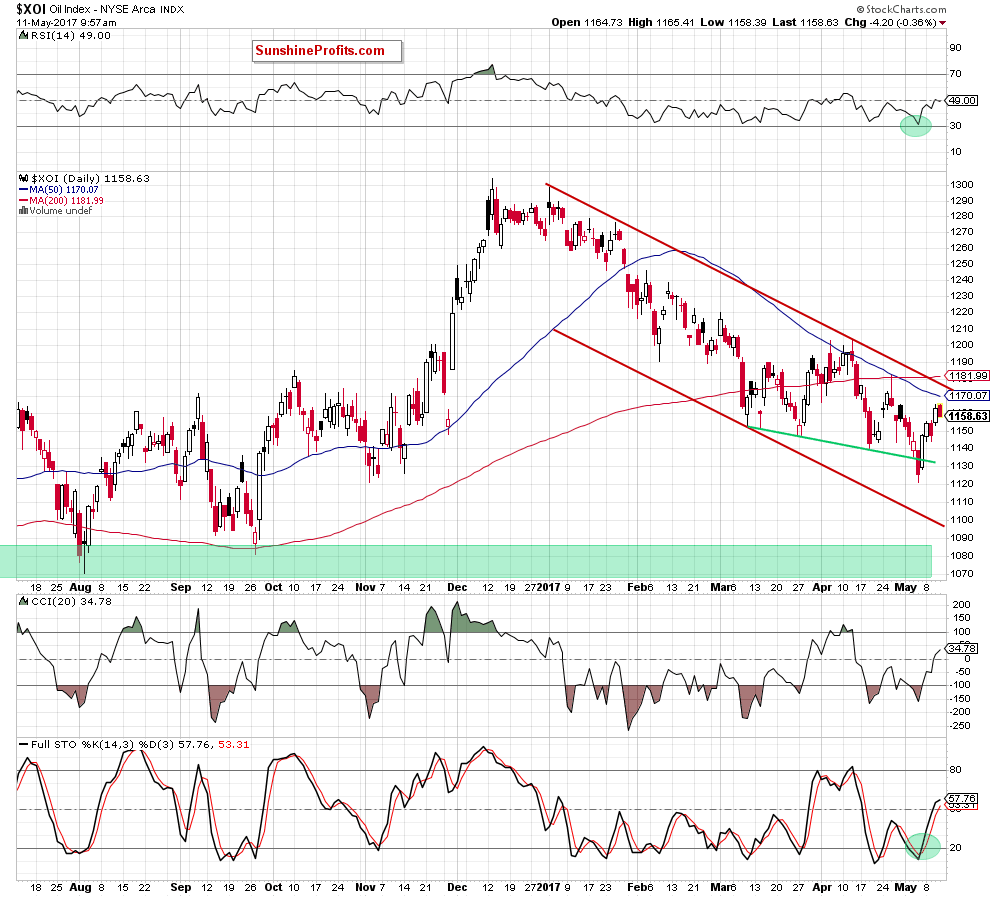
How high could oil stocks go? Let’s take a closer look at the daily chart.

On the daily chart, we see that oil stocks rebounded in the previous week, invalidating the earlier small breakdown under the green support line based on the previous lows. Additionally, all indicators supported oil bulls generating buy signals. Taking all the above into account, we think that oil stocks will extend gains and the initial upside target will be around 1,176, where the upper border of the red declining trend channel currently is.
Summing up,the short-term outlook for oil stocks is currently bullish as the XOI invalidated the earlier breakdown under the green support line based on the previous lows. Additionally, oil stocks bounced off the green support zone (seen on the weekly chart), which together with the buy signals generated by the daily and weekly indicators suggest further improvement in the coming week(s).
