Get 40% Off
These stocks are up over 10% post earnings. Did you spot the buying opportunity? Our AI did.Read how

Will Italy Take Down The Equity Bull? Here's The Historical Context

Published 05/30/2018, 12:11 AM
Updated 07/09/2023, 06:31 AM

THE MARKET'S NEW HOT TOPIC

Markets tends to move from one hot topic to the next. The latest concern stems from political uncertainty in Italy. Any time stocks drop over 1%, it's unsettling. Therefore, it can be helpful to put recent volatility in some historical context.

WILD SWINGS ARE NOT ABNORMAL

In 2011, markets were nervous about Europe, as noted in the Time magazine headline below dated September 29, 2011.

Time Magazine Headline, 2011


As concerns about Europe increased in 2011, stocks plunged in August, then remained in a wide, violent, and frustrating period of consolidation for several months.
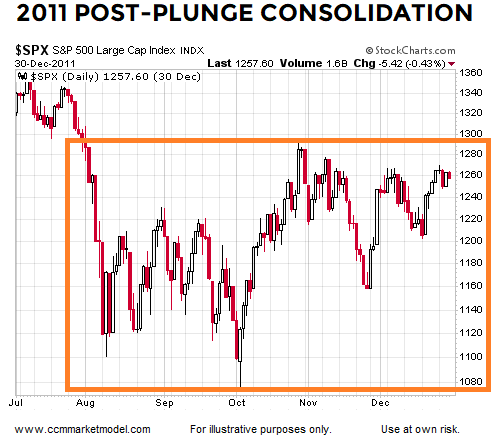
SPX Daily 30 December 2011

In the period shown above, stocks were red on 60 trading days; 33 trading days featured a loss of 1% or greater. There were no shortages of emotional swings for those watching the markets tick-by-tick in 2011. The thick and long red candlesticks above indicate strong selling pressure.

AFTER THE PERIOD OF CONSOLIDATION

Is it possible for stocks to plunge, consolidate for several months, have numerous gut-wrenching 1% down days, and then go on to make higher highs? As shown via the chart below, the answer is yes, it is possible. From the plunge low in 2011, the S&P 500 eventually righted itself and went on to post very satisfying gains for patient investors.
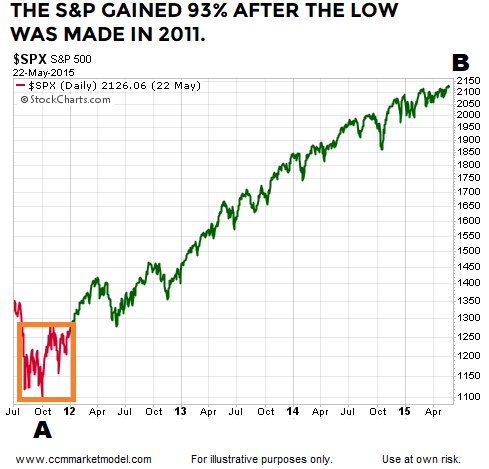
SPX Daily 2011-2015


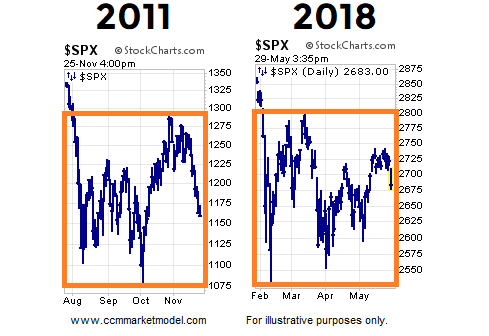
2018: Plunge FOLLOWED By Consolidation

The purpose here is not to say that 2018 is exactly like 2011, nor is the purpose to forecast bullish outcomes in 2018. The purpose is to illustrate that a sharp plunge, followed by a consolidation period featuring volatile swings and numerous 1%-down days is far from unprecedented, nor abnormal in the financial markets.
3rd party Ad. Not an offer or recommendation by Investing.com. See disclosure here or remove ads .

SPX Daily 2011 vs 2018

COMPARISONS TO 2000 AND 2008

This week's video makes longer-term comparisons to the major bull market peaks in 2000 and 2008. The charts help us better understand the probability of good things happening relative to the probability of bad things happening.

THE ISSUE IN 2011 WAS EUROPE, NOT THE U.S. DEBT DOWNGRADE

A logical question might be, but what about the downgrade to U.S. debt in 2011? If investors were overly concerned about a U.S. debt default in 2011, they would not have been buying long-term U.S. Treasury bonds (iShares 20+ Year Treasury Bond (NASDAQ:TLT)). TLT did quite well during the period shown below, telling us the primary issue was Europe.
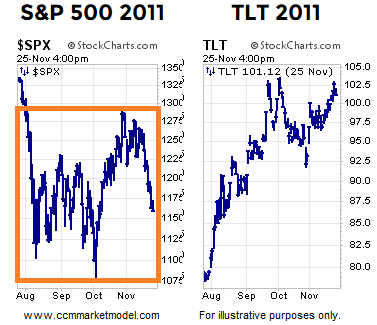
SPX vs TLT 2011

Latest comments

Risk Disclosure: Trading in financial instruments and/or cryptocurrencies involves high risks including the risk of losing some, or all, of your investment amount, and may not be suitable for all investors. Prices of cryptocurrencies are extremely volatile and may be affected by external factors such as financial, regulatory or political events. Trading on margin increases the financial risks.
Before deciding to trade in financial instrument or cryptocurrencies you should be fully informed of the risks and costs associated with trading the financial markets, carefully consider your investment objectives, level of experience, and risk appetite, and seek professional advice where needed.
Fusion Media would like to remind you that the data contained in this website is not necessarily real-time nor accurate. The data and prices on the website are not necessarily provided by any market or exchange, but may be provided by market makers, and so prices may not be accurate and may differ from the actual price at any given market, meaning prices are indicative and not appropriate for trading purposes. Fusion Media and any provider of the data contained in this website will not accept liability for any loss or damage as a result of your trading, or your reliance on the information contained within this website.
It is prohibited to use, store, reproduce, display, modify, transmit or distribute the data contained in this website without the explicit prior written permission of Fusion Media and/or the data provider. All intellectual property rights are reserved by the providers and/or the exchange providing the data contained in this website.
Fusion Media may be compensated by the advertisers that appear on the website, based on your interaction with the advertisements or advertisers.
© 2007-2024 - Fusion Media Limited. All Rights Reserved.