We know that the Gold and Silver stocks lead the metals at key turning points. The stocks started their bear market well ahead of Gold. This year the stocks have exhibited excellent relative strength. Gold and Silver are up less than 10% this year while Market Vectors Gold Miners (ARCA:GDX) is up 27% and Market Vectors Junior Gold Miners (ARCA:GDXJ) is up 43%. In recent days GDX and GDXJ reached 10-month highs relative to Gold. Global X Silver Miners (NYSE:SIL) hit a 10-month high relative to Silver while SILJ, the silver juniors hit an 18-month high against Silver. The outlook for the miners remains positive but the miners are awaiting and need more strength from Gold.
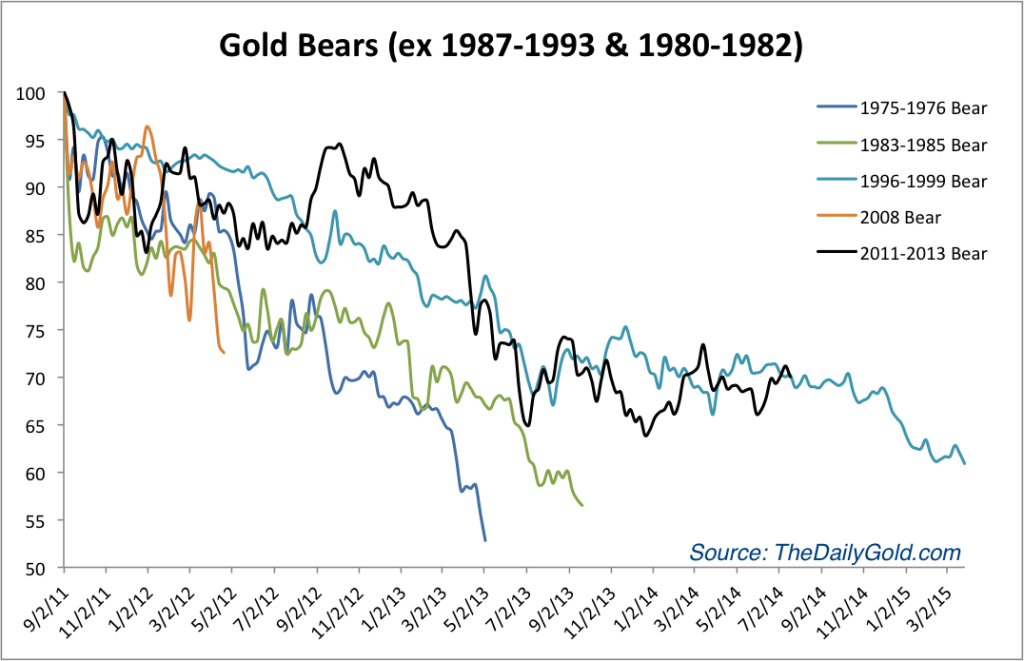
Unlike the gold miners and Silver, Gold never reached a bear market extreme relative to its history. The chart below plots the bear markets in Gold and excludes the most severe bear in terms of price (1980-1982) and time (1987-1993). The bulls can say that Gold has bottomed because the miners did in December 2013. However, the bears can say the current price action is remarkably close to that of the end of the 1996-1999 bear. Until Gold takes out the March highs on a weekly basis the bears have to be respected.
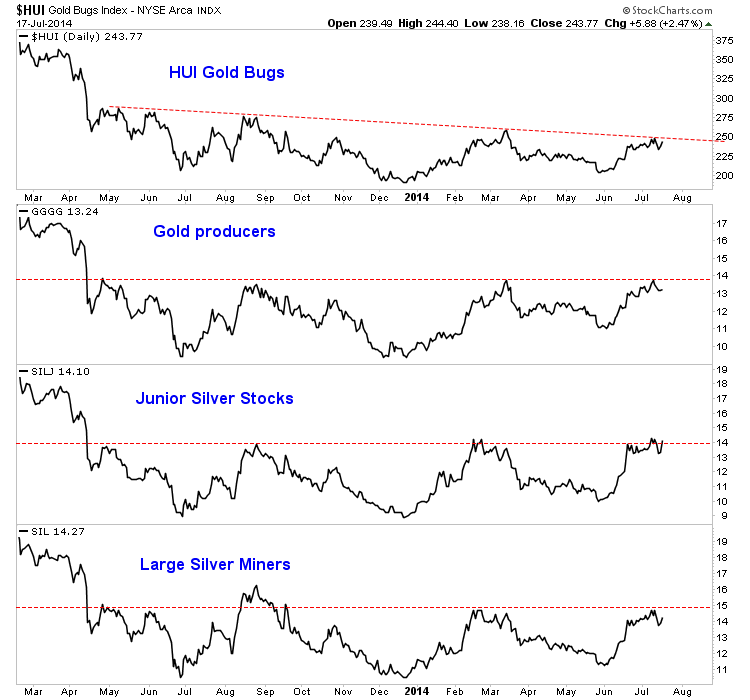
Meanwhile the miners remain in excellent shape beyond a short-term perspective. We’ve already noted their relative strength. The chart below plots several different indices including the ARCA Gold BUGS Index. The price action is bullish as the miners bottomed in December, made a higher low at the end of May and rallied back to the March highs. These indices are all very close to a major breakout. They are now in the 15th month of this long bottoming process. The topping process from late 2010 to early 2012 was just as long.
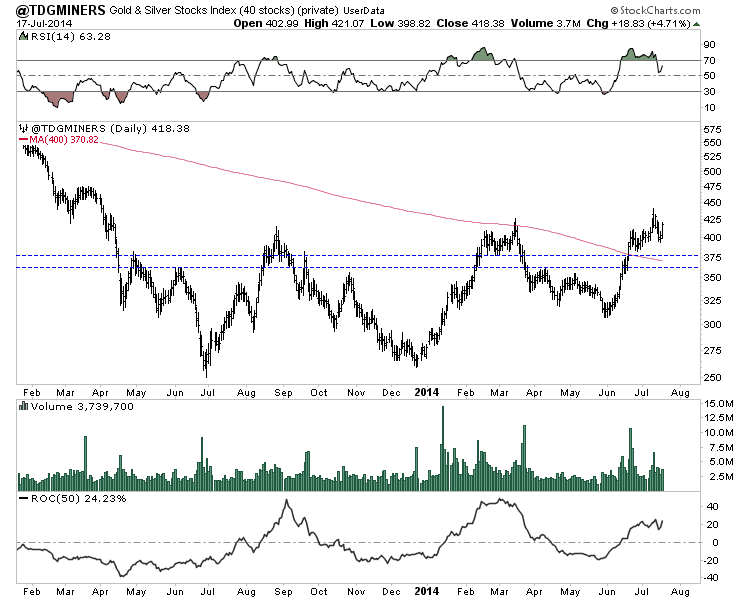
Our top 40 index which has a median capitalization of $750 Million, has already made a higher high and a 15 month high. Though it’s not too overbought, it has surged over 30% in about five weeks. The index stopped at the 400-day moving average in March but has advanced above it in recent weeks. On Thursday the index closed at 418. The 400-day moving average is at 371. That is an 11% decline from Thursday’s close. The 50% retracement of the recent advance is at 374.
We know that the miners are very close to a big breakout while Gold could move lower before it moves a lot higher. Back in 2001, the gold stocks bottomed more than four months ahead of Gold. After Gold confirmed its bottom, the miners surged 68% in two months. While the miners are close to a major breakout, perhaps it won’t happen until Gold is ready to rise. The miners could retrace half or even 62% of the recent gains and remain in a strong technical position. That could coincide with weakness in Gold which has formed a bearish reversal on the weekly chart.
Another point is the majority of important breakouts in the miners from 2000 to 2010 occurred in September. Last week we mentioned taking advantage of dips. Now we have one and it could be on the larger side. Taking advantage of upcoming weakness could be critical as it would be in advance of potentially the most important breakout in the miners in many years.
Good Luck!

