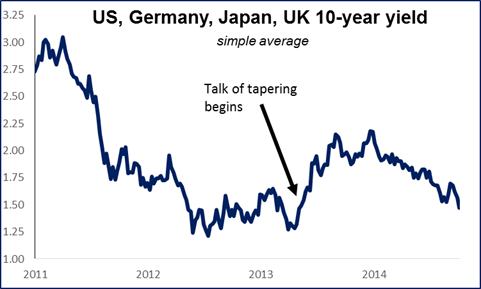
I wonder if he meant it that way As I mentioned yesterday, Fed Vice Chair Stanley Fischer said over the weekend that if foreign growth is weaker than anticipated, the Fed might “remove accommodation more slowly than otherwise.” This seemed to me to be a perfectly normal thing to say, judging by the Gittler Inversion Rule, which is: if a statement doesn’t make any sense when turned around, then it’s not particularly significant. In this case, can you imagine him saying “we will remove accommodation faster if foreign growth is weak” or even “we plan on ignoring the condition of the rest of the world when we set monetary policy”? Since the opposite of his statement is hardly imaginable, then what he said did not represent a choice among various possible paths but rather was only an expression of common sense. Nonetheless, the market clearly didn’t see it that way. On the contrary, the implied interest rate on Fed funds futures collapsed nearly 10 bps further while at the long end, 30-year bonds broke below 3% for the first time since May 2013.
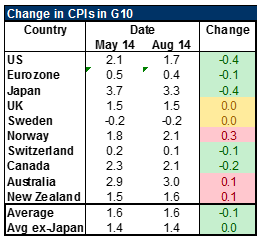
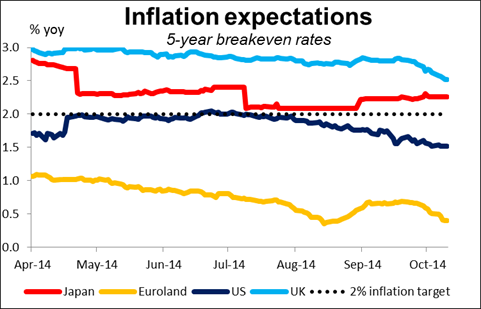
It’s clear the market believes something has changed fundamentally. Inflation rates are falling and both inflation expectations and interest rates are falling with them. Since the beginning of August, the five-year breakeven inflation rate has come down by 40 bps in the US, 18 bps in the Eurozone, and 29 bps in the UK. (It’s risen in Japan, but that looks like a problem with changing the bonds that it’s calculated from.) Long-term interest rates are nearly back to where they were before the talk of Fed tapering began. It seems that not only are market participants becoming worried about the inflation outlook, but also they are becoming worried about central banks’ ability to do anything about it. That is probably the bigger concern. Since the Greenspan days, it was always assumed that if the world got into trouble, the central banks would ride to the rescue. Now the markets are wondering whether this is even possible. With policy rates already at zero and waning confidence in the efficacy of quantitative easing, investors are wondering what kind of material – if any -- the global safety net is woven out of. The omnipotence of central banks is being questioned.
Still, the market activity shows people are not throwing in the towel yet. The fact that the growth-sensitive SEK, AUD and NZD were the best-performing G10 currencies over the last 24 hours shows remarkable confidence in global growth at a time when stock markets are down so much. (Note that the Australian market was up overnight, although New Zealand was down.) SEK may have gained in anticipation of higher inflation out today (see below). The antipodean currencies got a boost from the PBOC, which cut its repo rate for the second time in less than a month. While the market may be hoping for some more broad-based easing, Market News International quoted “a source close to the PBOC” as saying this was not part of Beijing’s ongoing “targeted easing” measures but just an attempt to ease the burden on small companies. Thus I would expect the global stock market rout to be a more powerful influence on AUD and NZD and see a strong possibility that the currencies fall back again.
Today’s activity: During the European morning, the main event will be the ZEW survey for October. Both the current situation and the expectations indices are forecast to have declined, with the latter touching zero for the first time since November 2012. This will add to the evidence that the recovery in Eurozone’s growth engine is petering out and could hurt the euro. Eurozone industrial production for August is estimated to have fallen 0.9% yoy, a sharp turnaround from +2.2% yoy in July. A fall increases the danger of a decline in Eurozone Q3 GDP. Elsewhere, France’s CPI for September is expected to have slowed.
The UK inflation rate is forecast to have slowed for a third consecutive month in September, which could scale back expectations for BoE tightening and encourage Cable bears to take another run at the sub-1.6000 territory. We also get the PPI rate for the same month. The forecast is for the rate to have remained unchanged. However, the UK employment data for August comes out on Wednesday and average weekly earnings are forecast to have accelerated somewhat. Although I remain negative as far as the overall picture of the pair is concerned, a further improvement in the employment figure could change the picture.
In Sweden, the CPI rate is expected to have risen in September but to remain in deflation of -0.1%. If the rate turns positive, it could trigger a strong leg down in USD/SEK and perhaps open the way for the 7.1350 support zone, defined by the lows of the 9th of October.
The only indicator coming out from the US is the NFIB small business optimism for September, which is expected to have declined fractionally but remain near the highest level since October 2007. While this indicator is not particularly market-affecting, it’s well worth watching because of the Fed’s emphasis on the labor market. Small businesses employ the majority of people in the US.
The Market
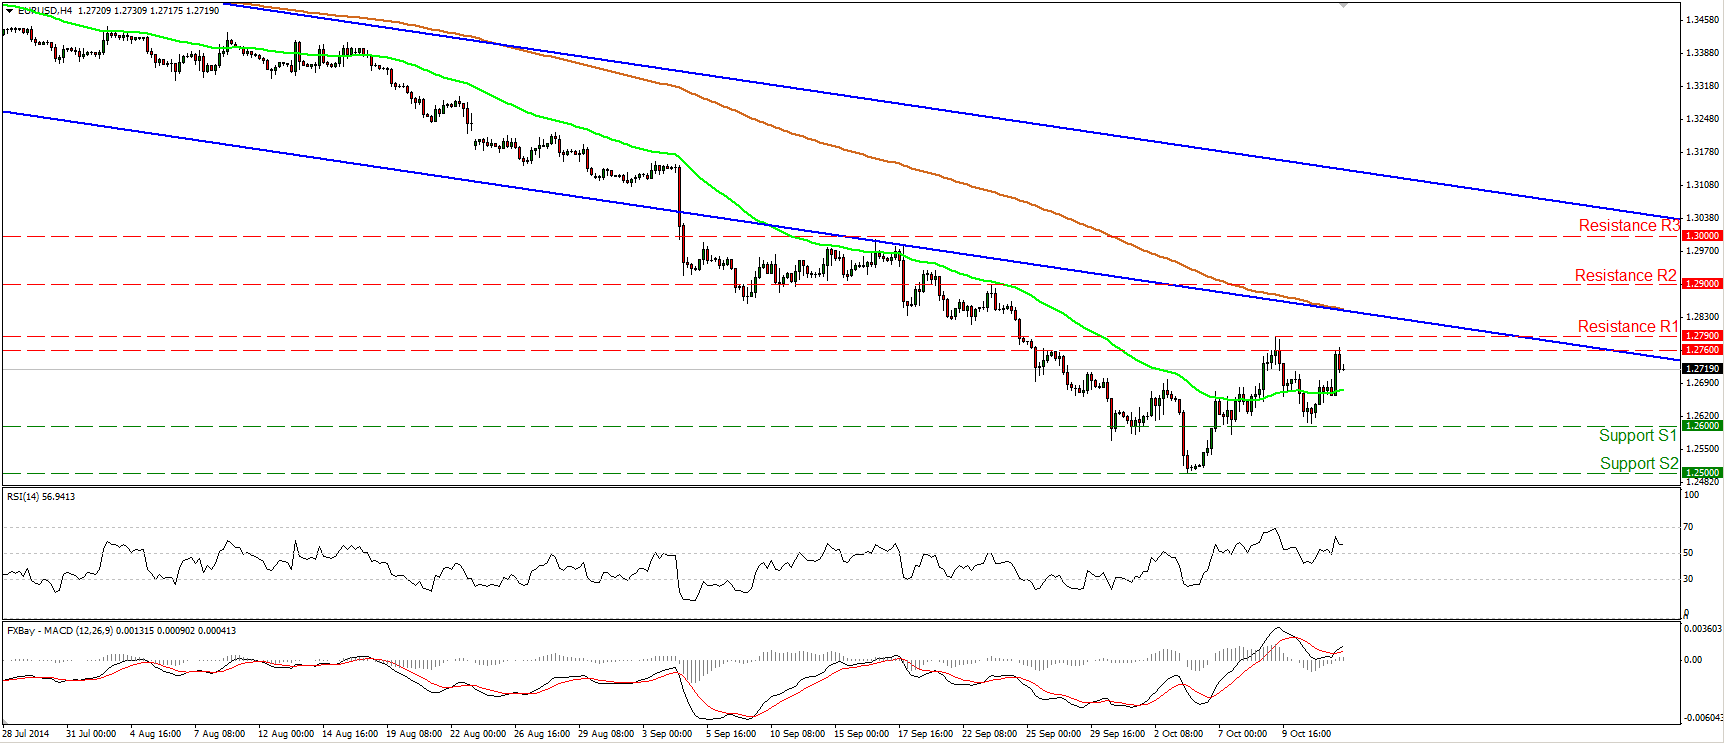
EUR/USD reaches the 1.2760/90 zone
EUR/USD moved higher on Monday, reaching the 1.2760/90 zone as expected. Although our daily momentum studies point towards further upside, I would take to the sidelines for now since the 1.2760/90 zone acted as a major support back in 2013 and it now acts as a major resistance, preventing the bulls from driving the battle higher. A dip below 1.2600 (S1) is likely to signal that the 3rd – 14th October corrective move is completed in that zone and could target once again the 1.2500 (S2) psychological level, which happens to be the 76.4% retracement level of the July 2012-May 2014 major advance. As long as the price structure remains lower peaks and lower troughs below both the 50- and the 200-day moving averages, I will maintain the view that the overall path remains to the downside. Hence, I will treat the recent up move or any extensions of it as a corrective phase for now.
• Support: 1.2600 (S1), 1.2500 (S2), 1.2465 (S3)
• Resistance: 1.2790 (R1), 1.2900 (R2), 1.3000 (R3)
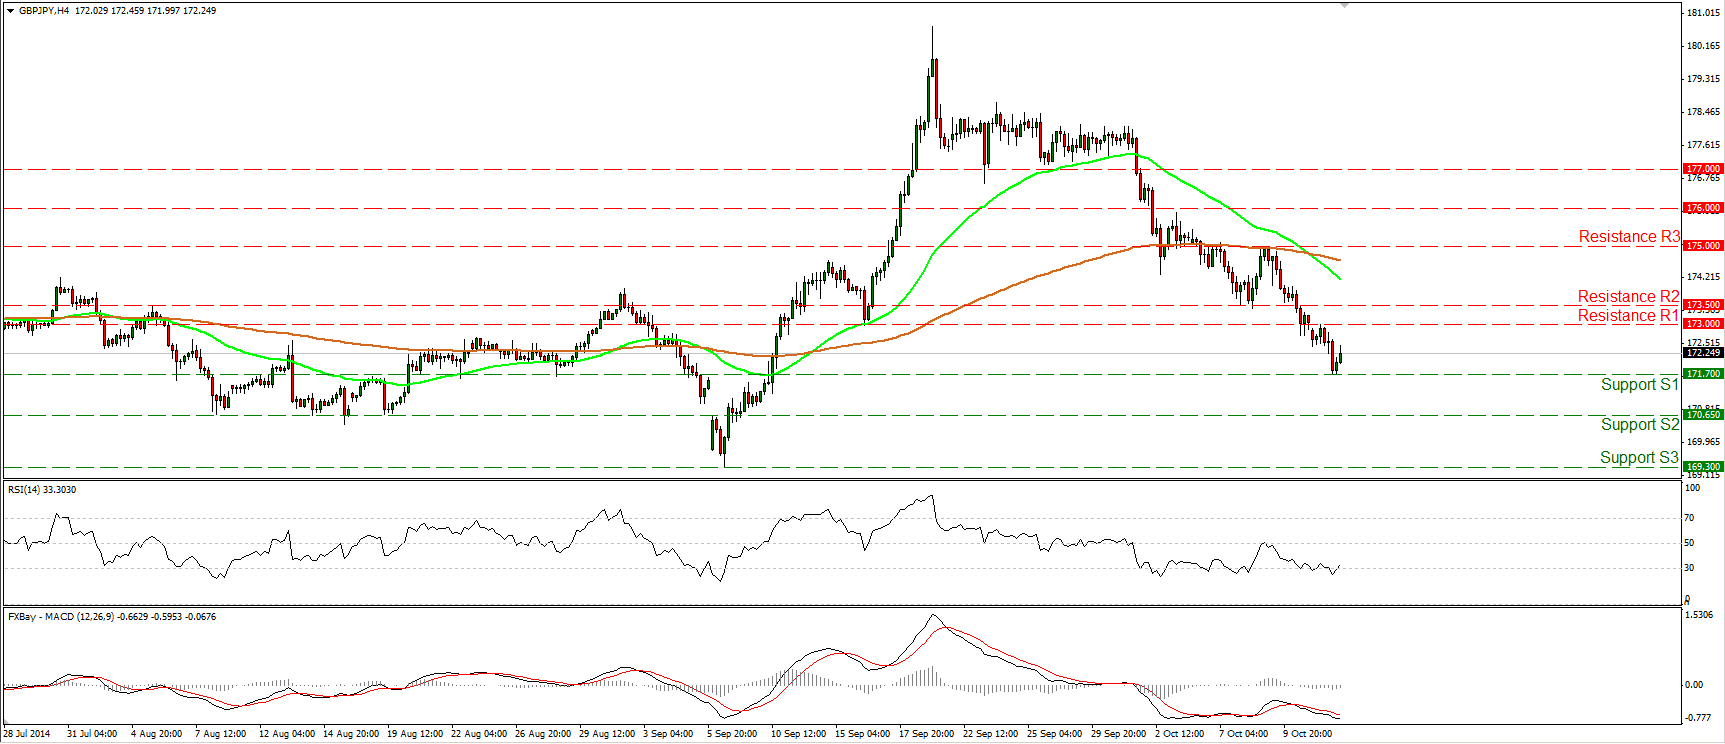
GBP/JPY finds support at 171.70
GBP/JPY continued tumbling yesterday, but the decline was halted at 171.70 (S1) and the rate rebounded somewhat. The pair is forming lower highs and lower lows below both the 50- and the 200-period moving averages, thus the short-term path remains to the downside in my view. Today, we get the UK CPI for September which is expected to have slowed. Something like that could cause the bears to break the support line of 171.70 (S1). If they manage to do so, I would expect them to set the stage for extensions towards our next support line at 170.65 (S2).
• Support: 171.70 (S1), 170.65 (S2), 169.30 (S3)
• Resistance: 173.00 (R1), 173.50 (R2), 175.00 (R3)
AUD/USD within a range
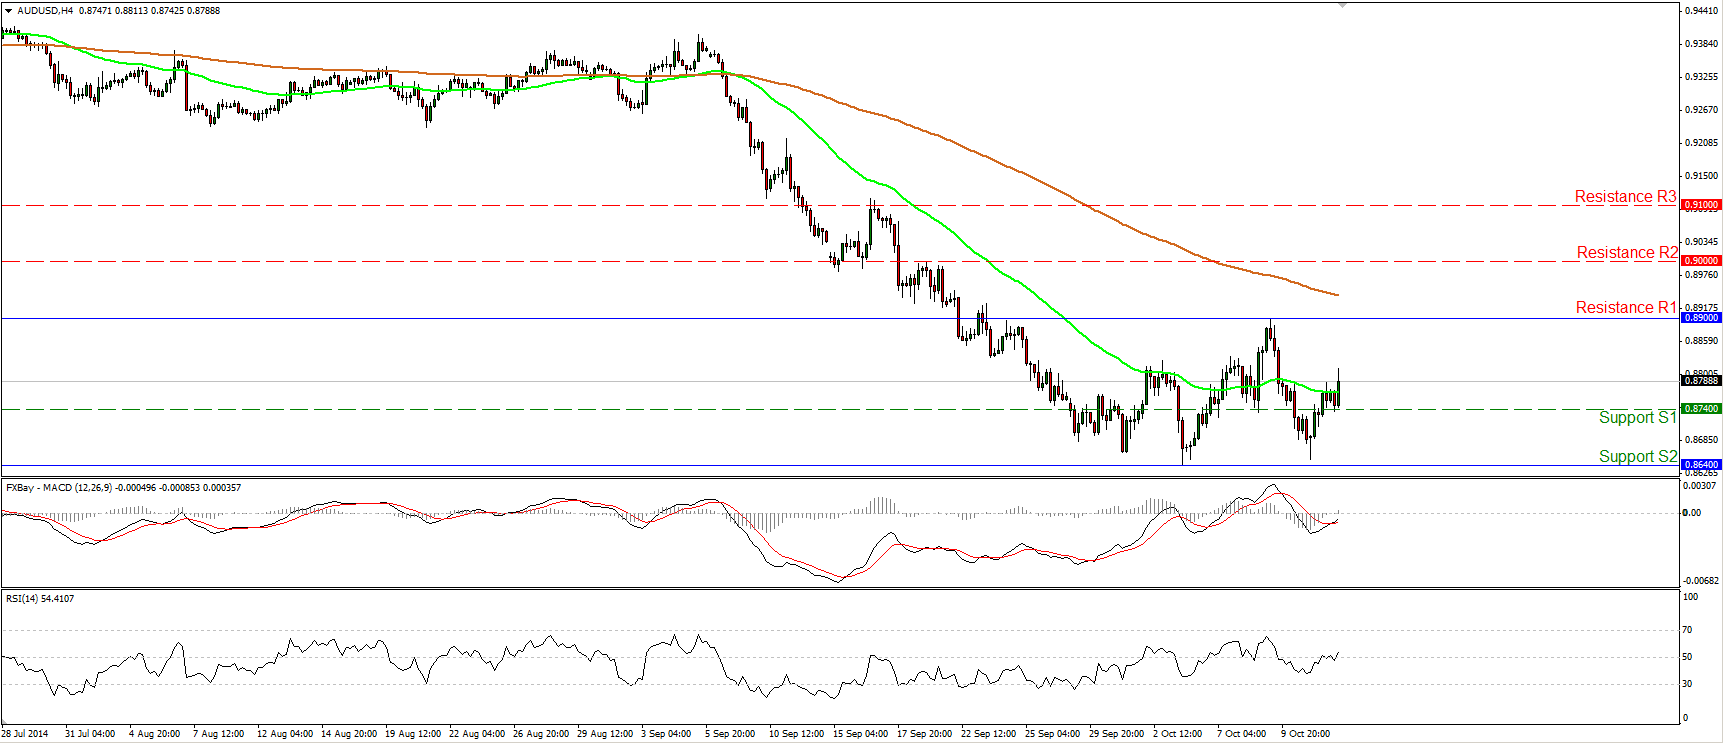
AUD/USD moved higher after finding support marginally above our obstacle of 0.8640 (S2). As far as the near-term picture is concerned, I see a sideways range between that support line and the resistance of 0.8900 (R1). As a result, I would expect another test near the 0.8900 (R1) area in the close future. As for the broader trend, I still see a downtrend. However, looking at our daily oscillators, I see that the 14-day RSI moved higher after exiting its oversold field and is now approaching its 50 line, while the daily MACD lies above its trigger and is pointing up. As a result I would wait for the bears to give more actionable signs that the downtrend is back in force before getting confident on the downside again.
• Support: 0.8740 (S1), 0.8640 (S2), 0.8565 (S3)
• Resistance: 0.8900 (R1), 0.9000 (R2), 0.9100 (R3)
Gold challenges the 1235/45 zone
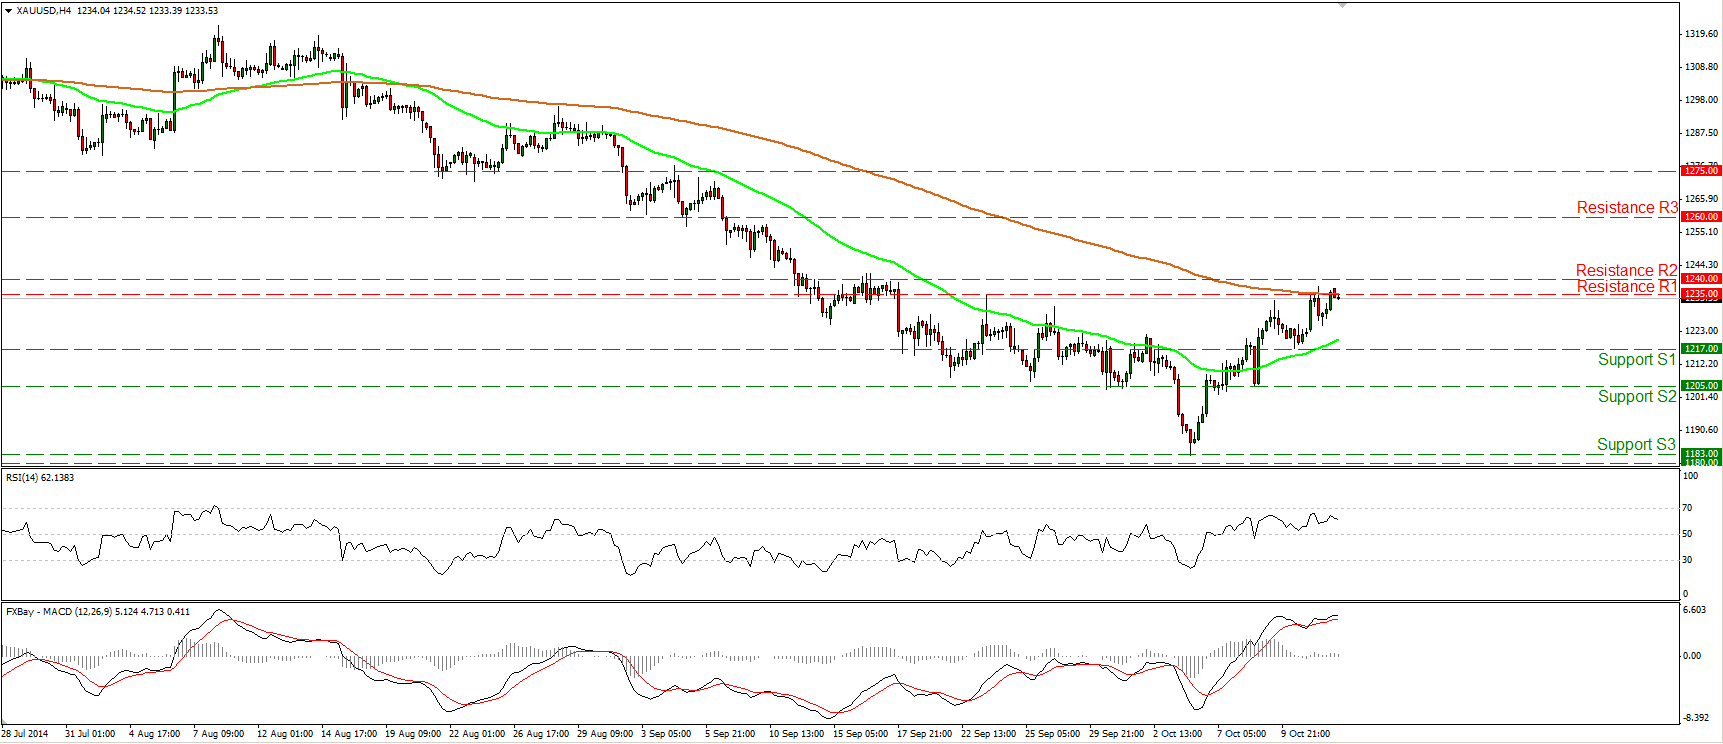
Gold moved somewhat higher on Monday and during the early European morning is challenging the resistance zone of 1235/1240 and the 200-period moving average. A clear and decisive move above that resistance area could probably pull the trigger for another leg higher, perhaps towards our next resistance hurdle at 1260 (R3). The notion is also supported by both our daily momentum indicators. The 14-day RSI remains above its 50 line, while the daily MACD, although negative, stays above its trigger and is pointing up. As far as the broader trend is concerned, I would maintain my “wait and see” stance for the same reasons I mentioned last week. On the 6th of October, the yellow metal rebounded strongly from the critical support zone of 1180/83, defined by the lows of June and December 2013, but the absence of any bullish trend reversal signals makes it premature to argue about any uptrend scenarios, in my view.
• Support: 1217 (S1), 1205 (S2), 1183 (S3)
• Resistance: 1235 (R1), 1240 (R2), 1260 (R3)
WTI in a consolidative mode
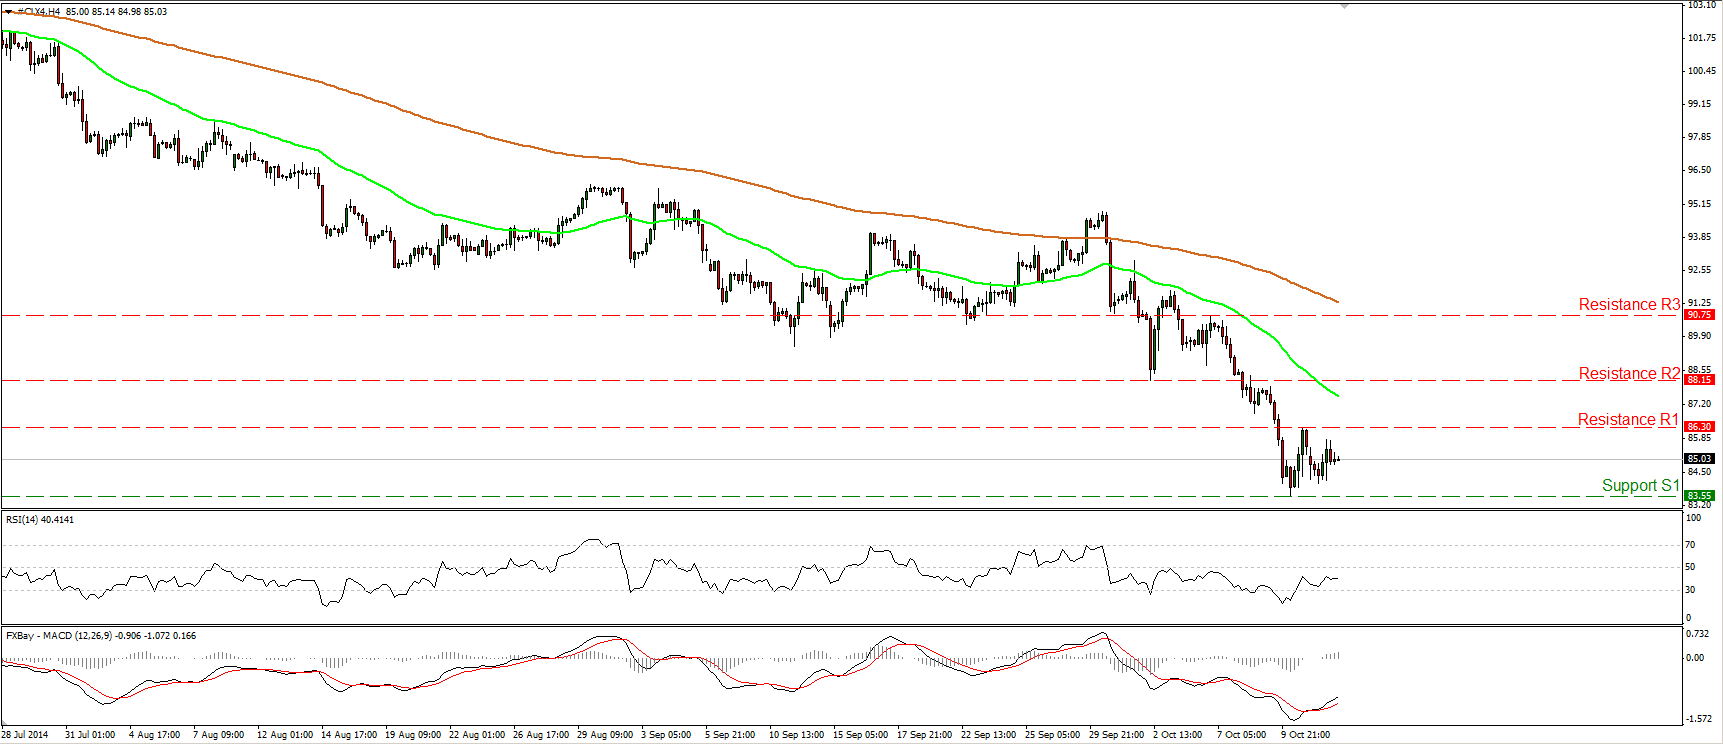
WTI moved in a consolidative mode yesterday, remaining between the support line of 83.55 (S1) and the resistance barrier of 86.30 (R1). On the daily chart, the price structure still suggests a downtrend, thus I would wait for a dip below the support line of 83.55 (S1) to open the way towards the low of the 2nd of July, near the 82.00 (S2) zone. The daily MACD remains below both its zero and signal lines, confirming the recent negative momentum of WTI, but the 14-day RSI found support near its 30 line, a line that is well respected by the RSI during the current price downtrend. As a result, I would be cautious of an upside bounce before the bears take the reins again.
• Support: 83.55 (S1), 82.00 (S2), 80.00 (S3)
• Resistance: 86.30 (R1), 88.15 (R2), 90.75 (R3)

