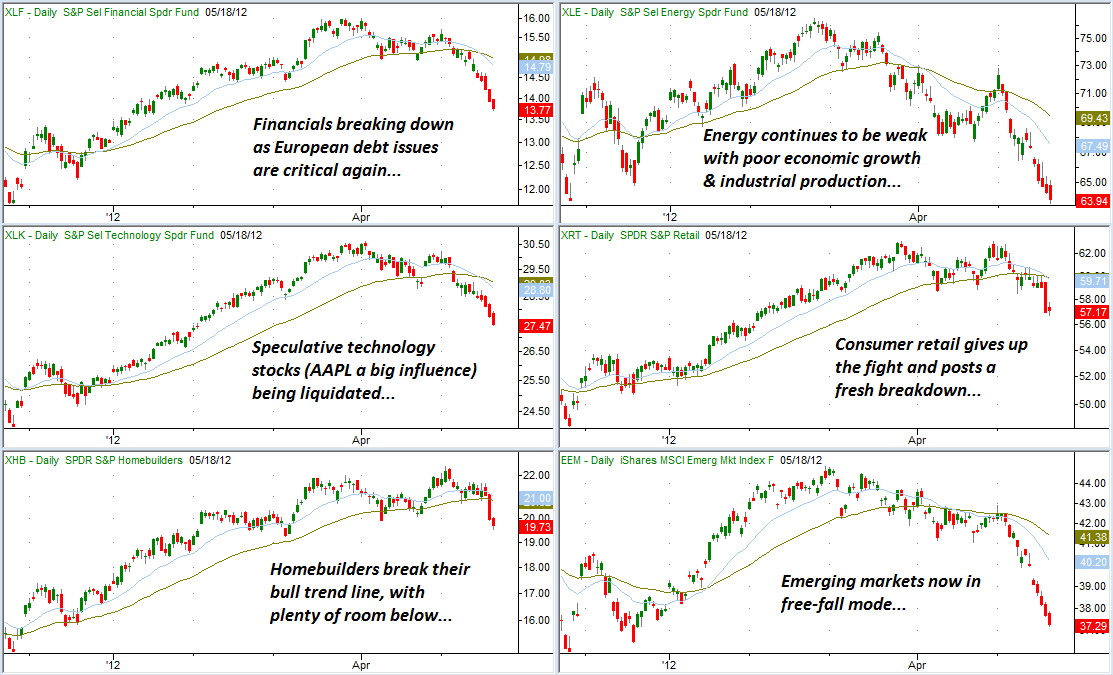
Investors bailed out of positions left and right last week, as the Greek debt situation spiraled out of control. There were precious few places to hide as retail investors hit the panic button and institutional managers were forced to meet redemptions.
Friday’s Facebook Inc. (FB) debut didn’t help matters any, as the well-publicized IPO wound up disappointing investors and igniting major losses for competing social media stocks.
The selling was broad – hitting speculative growth stocks as well as low-beta blue chip “value” stocks. Not only did the action cover an extremely wide range of sectors and industries, the selling was also relentless with the major US indexes posting losses every single day of the week.
To get a feel for just how widespread the selling has been, take a look at the various ETF charts below (click to enlarge)
Of course, whenever we have an extended bearish move like this, there is a significant chance that markets will experience a counter-trend rally. On a short-term basis, equities are significantly oversold and a “resolution” of the Greek crisis before markets open could send markets sharply higher this week. Such a “resolution” would be short-lived of course, and still wouldn’t even touch the larger looming problems with Spain and Italy.
Some of the most impressive short-term rallies have been posted within the context of overall bear market periods. Short sellers can get squeezed, and retail investors often jump back into the market after a modest bounce – for fear of missing the rebound. But then after the buying pressure has been exhausted, the bear market continues.
The key to profitability during these market environments is to stay nimble, manage profits on short positions carefully, and be willing to reduce bearish exposure (or even step back into short-term bullish positions) during the short-term rallies.
That’s exactly what we have been doing over the past several weeks – capturing profits on bearish swing trades, taking half profits on trend trades at key support areas, and tightening our risk points along the way.
Heading into this week, the environment still looks very bearish – unless an 11th hour Greek resolution is reached. We’re finding some great trade setups in this environment, with a number of new areas of interest discussed below…
Facebook Sinks the Social Media Ship
After what seems like years of hype and anticipation, Facebook Inc. (FB) finally began trading on Friday.
The stock was distributed to investors at $38 per share – pricing at the top of its range (typically a good indication of strong demand). When FB began trading in the open market, it was immediately clear that something was wrong.
In the first 20 minutes of trading, Facebook carved out its full day’s range – printing a high of $45 and a low of $38. Throughout the day, it settled into a volatile trading range in the low $40′s before falling all the way to close just barely above the offering price.
Not only was Facebook’s 1% gain a tremendous disappointment, it also set the tone for the entire social media complex. With the king of all social media companies receiving a cool reception from Wall Street, investors in existing social media stocks saw the writing on the wall and high-tailed it towards the exits.
- LinkedIn (LNKD) dropped 5.2%, breaking its bullish trend line
- Yelp (YELP) fell 12.6%, posting a new all-time low
- Zynga (ZNGA) also hit a new low, falling 13.3% on the day
- Groupon (GRPN) closed 6.9% lower, giving back much of its recent gains
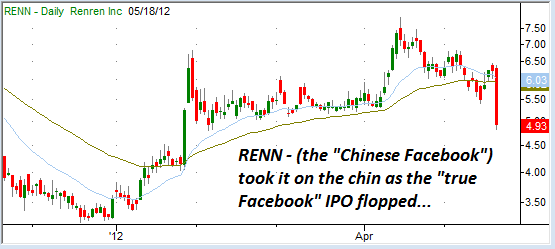
- Renren (RENN) was off 22% as the “Chinese Facebook” broke support
At this point, social media stocks look very oversold on their short-term charts. But it is clear that investor sentiment is making a dramatic shift away from this area – and we will likely see plenty of follow-through over the next several weeks and months.
We’re keeping a close eye on the individual stocks within the group, and will likely roll out short positions once the stocks have had a chance to post minor consolidation periods. This gives us an opportunity to enter on a continuation of the bearish action – and place our risk points in a reasonable area to avoid getting stopped out by random fluctuations. 
Retail Apparel: Major Trend Shift
Consumer stocks held up surprisingly well throughout the majority of 2011 and in the first quarter of this year. Even though global economic growth was in question and equities went through some choppy periods, luxury niche retailers pushed forward with affluent consumers continuing to buy their goods.
But over the past few weeks, several key apparel retailers have reported earnings and offered disappointing guidance.
- Aeropostale (ARO) beat estimates but says Q2 will be challenging.
- Saks Inc. (SKS) posted disappointing revenue – marking down prices.
- Zumiez Inc. (ZUMZ) stock fell 8% on a weak Q2 outlook.
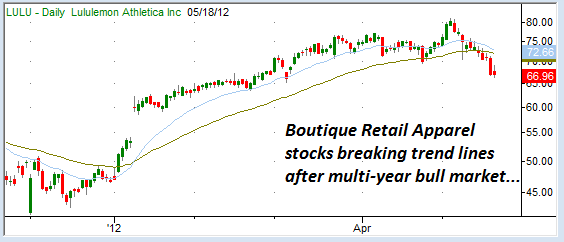
Plenty of other names in the group (Abercrombie & Fitch (ANF), Gap (GPS), Ann, Inc. (ANN), Lululemon (LULU) to name a few) are now trading below key trend lines and EMA support levels. Whenever a large number of leading stocks in a particular industry break down at the same time, it is important to pay attention.
Considering the long run that apparel stocks have had, we can expect a couple of things from this group over the next few weeks.
First, the “true believers” are likely to buy the dips – as they have been conditioned to expect the trends to continue. These buy orders are likely to kick in and help support the former leading stocks – and we’re likely to see some drift or consolidation after the initial breakdowns already logged.
After the buy orders are filled, there is a high probability that the group will continue to fall. Technically speaking, there is a lot of room for many of these stocks to establish bearish trends before hitting key support areas. This “continuation action” is when short sellers typically add pressure, and long-term investors are forced to start thinking about taking profits off the table while they still have some.
Bearish action in this group coincides with the general “risk off” sentiment experienced by both retail and professional investors. 
Oil and Gas Producers: Victim to Slowing Growth
All eyes may be on the drama in Europe right now, but the sovereign debt crisis isn’t the only major macro issue that investors need to be focusing on.
Last week we talked about decelerating growth in emerging markets. (The iShares Emerging Market Index – EEM – dropped 6.7% last week by the way.) As emerging market growth slows, and developed nations face their own set of challenges, energy demand is coming under pressure.
So far this month, oil has not only dropped below the psychological $100 per barrel area, the decline has actually picked up intensity with the $90 price level likely to be challenged this week. For oil producers with exposure to spot prices (ie. not hedged with long-term contracts), this decline has a direct effect on immediate profits.
A recent bump in the price of natural gas is little consolation. The United States Natural Gas Fund (UNG) has bounced more than 30% from its April low, but still sits below the price level it started the year (and gas would still have to rally well over 100% to reach 2011 levels).
Oil and gas producers are trading in lockstep with the price of oil – setting up some interesting short opportunities for the coming weeks. We’re not interested in stepping in immediately (the charts are oversold on a short-term basis), but a consolidation or drift would make things very interesting.
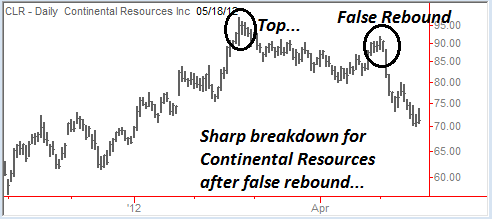
Continental Resources (CLR) is both an oil and gas producer and is trading at roughly 20 times expected earnings for this year. The premium price makes sense when oil prices are high enough to drive profit growth expectations higher, but with the decline in oil prices, analysts are likely to reduce their estimates and the earnings premium is already taking a hit.
A two or three day respite could very well be enough of a pause to give us a shot at setting up a new trade, and there are a number of other attractive patterns emerging for this group. 
This week, the broad market is likely to have a very binary personality. As long as uncertainty looms for Greece, it will be very difficult for the bulls to muster any strength. Absent any “solution,” there is little reason to expect the tone to differ much from last week’s bearish action.
But considering the short-term oversold nature of this market, a relief rally could be very intense. News of a debt restructuring for Greece, a stimulus package, or even a rumor of progress being made could ignite a short-covering rally.
We’ve been able to book some solid profits on our bearish swing trades, and have some great trend trades still on the books. But we’re particularly wary of a sharp bear market rally – and have aggressively tightened our risk points along the way.
Buckle up for a very important week with plenty of volatility expected.
Disclosure: This content is general info only, not to be taken as investment advice. Click here for disclaimer
