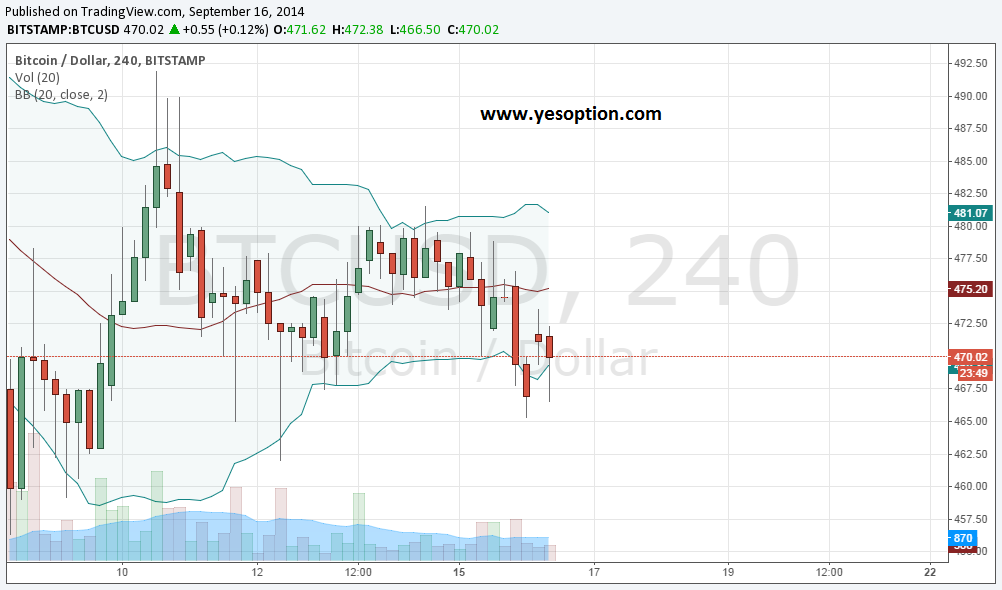
The bitcoin price has stumbled to $469.15, losing almost half a percentage point over the past 24 hours. If losses are extended pat $455, we could see a move to the low $400 levels materialize. However, the market is expected to trade sideways today, as recently the price has been trading in a narrow range, bouncing in-between the Bollinger Bands®.
The Bangladesh central bank has recently banned Bitcoin and users face up to 12 years in jail. The central bank has said that the use of crypto-currencies is unlawful under anti-money laundering laws and this decision has arisen from local media reports highlighting the use of Bitcoin by Bangladeshi citizens. This stands in contrast to other central bank reactions. While most have expressed concerns about the potential risks of using Bitcoin, only 4 countries have banned it outright.
Almost 50% of wealth Chinese residents are planning to leave China and move abroad over the next five years. This trend is bullish for Bitcoin, as it will enable them to move their money at virtually no cost. Over the long-term, buying pressures could increase in China as those who want to emigrate could use the crypto-currency to keep their wealth hidden from authorities, as well as protecting it from high currency exchange fees.
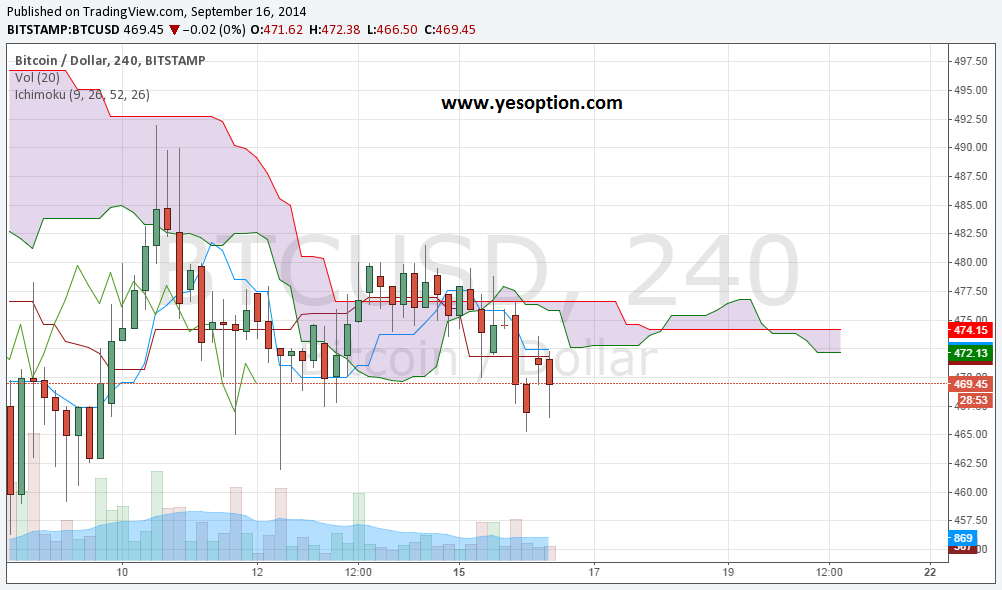
The 4-hour chart with the Ichimoku cloud below shows that the price has breached the cloud in the downward direction in the past 24 hours, which marks the start of a potential downward trend. The price has also closed below the base line, indicating bearish momentum. The $427-$473 level, which forms the bottom of the cloud will act as resistance over the past 24 hours and a break above this level and above $476 will be considered bullish. Traded volumes on the BitStamp exchange have been relatively low today

The price is currently at the lower Bollinger Band®, suggesting that the price will tend to the middle band at $475.20 over the next day or two. The low volumes suggest that traders who are taking selling positions are losing the upper hand and are weakening. Also, the lower price should attract buyers who want to take advantage of the recent price decrease, so moderate buying volumes are expected over the course of the day.

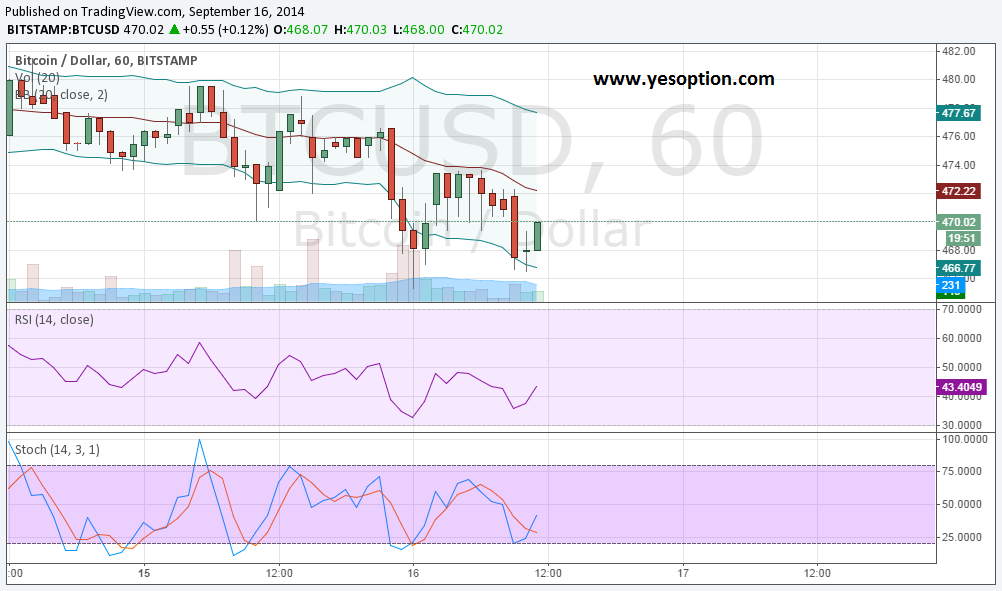
Looking at the hourly chart below, we see that over the past three hours, the volumes indicate indecisiveness, as low selling and buying volumes have preceded one another. The price action is currently tending towards the middle Bollinger Band® at the $472 level. It seems that the price will settle around $470 today. If the relative strength index moves above 50, which is currently at 43.4, we could see more buying volumes and a move past $470. The stochastic implies that there is further room for moves to the upside but also to the downside, as the conditions are neither oversold nor overbought.

Trade BTC/USD and over 125 other assets at YesOption – The leading forex and binary options trading platform-offering returns up to 89%.
