
Torchmark Corporation (NYSE:TMK) remains well-poised for growth, banking on better-performing American Income Exclusive Agency, consistent operations at Global Life and an effective capital deployment. This Zacks Rank #3 (Hold) life insurer remains promising on the back of a number of growth drivers.
Northbound Estimates: The stock has seen the Zacks Consensus Estimate for both current and next-year earnings being revised a cent upward over the last 60 days.
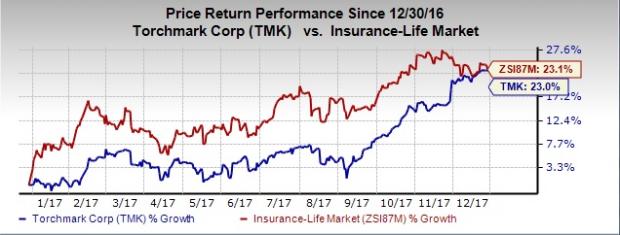
Price Performance: Shares of Torchmark have rallied 23% so far this year, outperforming the S&P 500 index’s gain of 20.1%. However, the shares have slightly underperformed the industry’s growth of 23.1%.
Positive Earnings Surprise History: Torchmark has surpassed the Zacks Consensus Estimate in all the last four quarters with an average beat of 2.17%.
Growth Projections: The Zacks Consensus Estimate for current-year earnings per share is pegged at $4.80 on revenues of $4.1 billion, representing a year-over-year top and bottom-line improvement of 4.8% and 5.3%, respectively.
For 2018, the Zacks Consensus Estimate for earnings per share stands at $5.15 on revenues of $4.3 billion, representing a year-over-year increase of 7.3% and 4.1%, respectively.
Torchmark has expected long-term earnings per share growth of 7.2%.
Underpriced: Looking at the company’s price-to-book ratio — the best multiple for valuing insurers because of large variations in their earnings results from one quarter to the next — shares are underpriced at the current level. The company has a trailing 12-month P/B ratio of 2.04, falling below the industry average of 3.8.
VGM Score: Torchmark carries a VGM Score of A. Here V stands for Value, G for Growth and M for Momentum with the score being a weighted combination of all three factors.
Growth Drivers in Place
American Income Exclusive Agency — Torchmark’s most important distribution channel — has been primarily fueling life premium and net sales. The company projects growth of 7% for life sales in 2017 and the same in the 6-10% range for 2018.
Declining negative impact due to lengthy delays in receiving Part D reimbursements has been driving improvement in excess investment income. Torchmark expects the metric to grow about 8-11% on a per share basis in 2017.
Torchmark estimates net operating income between $4.77 and $4.83 per share in 2017 on improved life underwriting income at American Income and health insurance businesses. For 2018, it guides the bottom line between $5 and $5.25.
Torchmark’s prudent capital management strategy has helped the company return 83% to its investors over a decade now. Banking on a solid capital position, the company’s dividend witnessed a five-year growth rate of 13.4%, better than the industry average of 5.8%. This apart the company engages into share buyback as well.
Riding on a strong operational performance, the company expects to generate free cash flow of $325 million in 2017 and between $310 million and $320 million in 2018.
Stocks to Consider
Some better-ranked life insurance stocks are American Equity Investment Life Holding Company (NYSE:AEL) , Primerica, Inc. (NYSE:PRI) and Lincoln National Corp. (NYSE:LNC) .
American Equity Investment develops and sells fixed index and fixed rate annuity products in the United States. The company came up with an average four-quarter positive surprise of 24.26%. Shares of the company have soared 46.5% in a year. The stock sports a Zacks Rank #1 (Strong Buy). You can see the complete list of today’s Zacks #1 Rank stocks here.
Primerica distributes financial products to middle-income households in the United States and Canada. The company delivered an average four-quarter positive surprise of 0.96%. Shares of the company have surged 39.9% in a year. The stocks carries a Zacks Rank #2 (Buy).
Lincoln National is a diversified life insurance and investment management company. It pulled off a four-quarter average beat of 9.83%. The stock carries a Zacks Rank of 2.
Today's Stocks from Zacks' Hottest Strategies
It's hard to believe, even for us at Zacks. But while the market gained +18.8% from 2016 - Q1 2017, our top stock-picking screens have returned +157.0%, +128.0%, +97.8%, +94.7%, and +90.2% respectively.
And this outperformance has not just been a recent phenomenon. Over the years it has been remarkably consistent. From 2000 - Q1 2017, the composite yearly average gain for these strategies has beaten the market more than 11X over. Maybe even more remarkable is the fact that we're willing to share their latest stocks with you without cost or obligation.
Primerica, Inc. (PRI): Free Stock Analysis Report
Lincoln National Corporation (LNC): Free Stock Analysis Report
Torchmark Corporation (TMK): Free Stock Analysis Report
American Equity Investment Life Holding Company (AEL): Free Stock Analysis Report
Original post
Zacks Investment Research