For the umpteenth year in a row, mainstream economists and analysts are once again planting the seeds of hope for a return to stronger GDP growth. The White House has hoped for it for the last 8-years, and now President-elect Trump is all but promising a surge in economic growth.
Unfortunately, while promises are great, we must analyze the reality of attaining such a lofty resurgence.
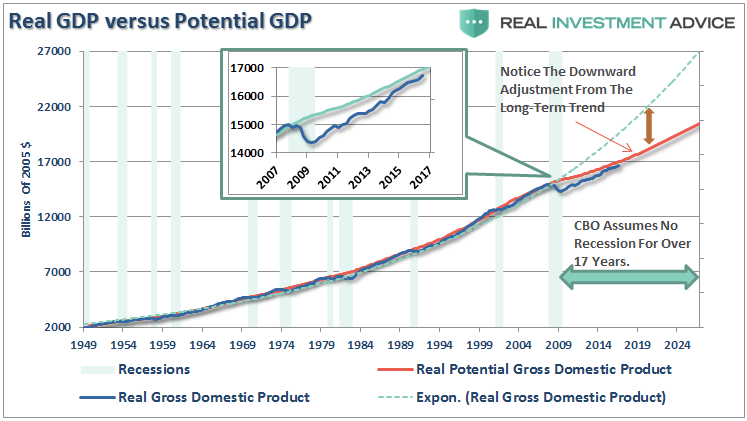
Let’s start with the Congressional Budget Office (CBO) and their projections for the next decade. This is shown in the chart below.
There are several very noteworthy observations which need to be made:
- Real potential GDP has been sharply reduced from the long-term exponential growth trendline (green dashed line) to close the gap between real GDP and “hope.”
- With the economy heading into its 8th year of growth without a recession, the CBO is currently projecting another 10-years of “recession-free” growth. The reality of this happening is very slim.
- While the output gap has closed, by reducing expectations, real GDP continues to underperform significantly against both reduced expectations and long-term reality.
What the data above tells us is that simply, the economy is currently operating well below its potential level. While the most visible culprits are employment, wages, industrial production and consumption, these issues are byproducts of the 50-Trillion pound Gorilla sitting quietly in the corner. That seemingly invisible Gorilla is simply – debt.
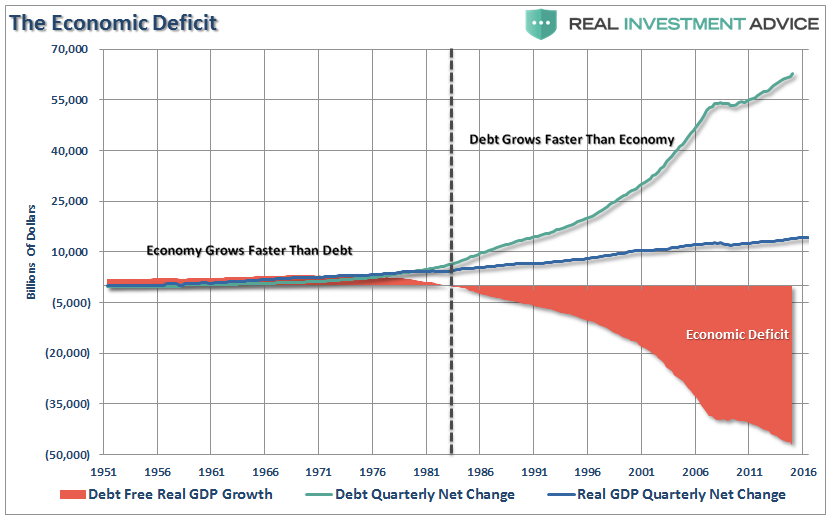
To get a better idea of what I mean, let’s take a look at economic growth in relation to debt levels. Prior to 1980, economic growth was entirely financed by economic activity as debt levels remained well below economic output.
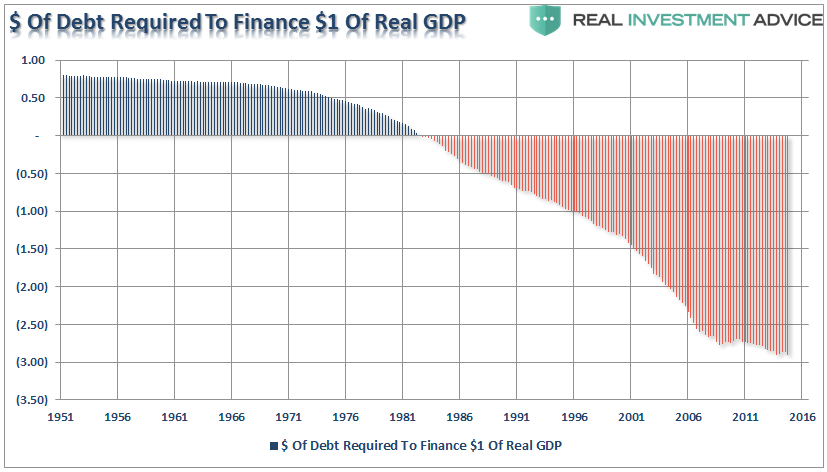
Today, that same $1 dollar of GDP growth requires almost $3 dollars to finance it. That’s right – nearly $3 of debt to finance $1 of GDP.
Therein, of course, lies the problem of returning to 4% economic growth in the foreseeable future. With real GDP currently at $16.7 Trillion and debt estimated at $65 Trillion, the ratio is 3.9:1 debt to GDP.
In order for GDP growth to reach 4% in 2017 (assuming 2% growth in Q4) – GDP would have to expand to roughly $17.7 Trillion. Subsequently, the debt would need to expand to $67.6 Trillion or a whopping $2.6 Trillion in the coming year. So forth, and so on.
Are you seeing the problem here?
The problem is simply the math.
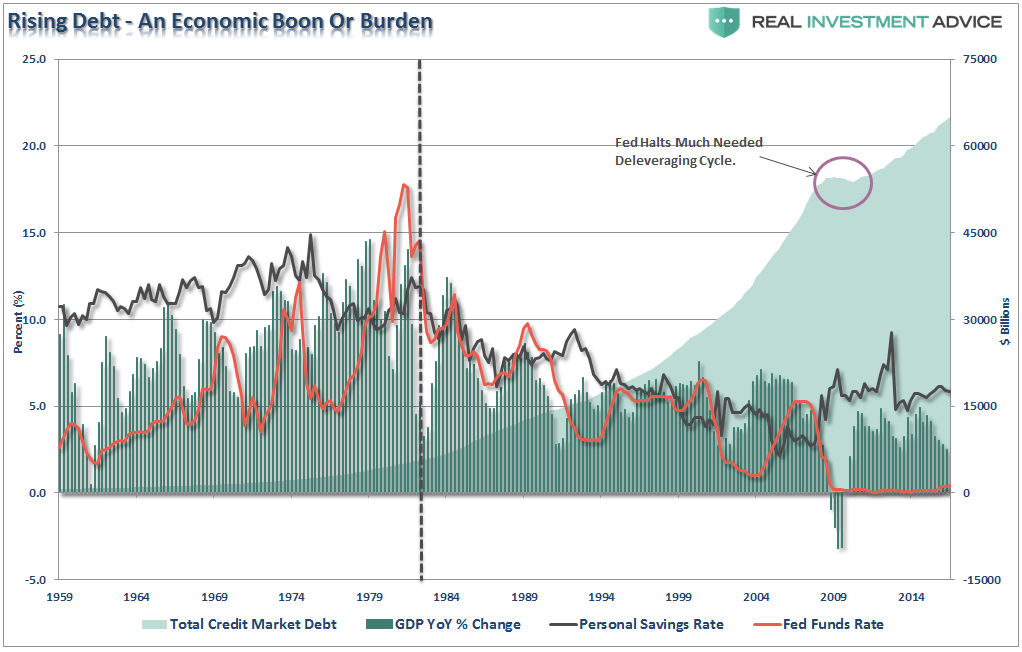
Furthermore, the current economic malaise is not something new that was caused by the financial crisis in 2008. The reality is that economic growth has deteriorated consistently since 1980. Economic growth cannot be supported by debt growth. Increases in debt reduce savings and productive investment. Debt, like cancer, consumes income which detracts from consumption and investment.
The larger the debt, the more consumption it requires.
As interest rates began their long march lower in the 1980’s so did economic growth. As growth rates began to slow, the need to maintain higher standards of living required a reduction in the personal savings rate and increases in debt. In turn, there was less available for productive investment. As each year passed quietly by, the cancer of debt spread, undetected and ignored, until it became terminal.
What we now realize, yet still try to ignore, is at the very heart of Austrian economic theory.
“As the inevitable consequence of excessive growth in bank credit, exacerbated by inherently damaging and ineffective central bank policies, which cause interest rates to remain too low for too long, resulting in excessive credit creation, speculative economic bubbles and lowered savings.”
In other words, the proponents of Austrian economics believe that a sustained period of low interest rates and excessive credit creation results in a volatile and unstable imbalance between saving and investment. Low interest rates tend to stimulate borrowing from the banking system which in turn leads, as one would expect, to the expansion of credit. This expansion of credit then, in turn, creates an expansion of the supply of money and, therefore, the credit-sourced boom becomes unsustainable as artificially stimulated borrowing seeks out diminishing investment opportunities. Finally, the credit-sourced boom results in widespread malinvestments.
Does any of this sound familiar?
The problem currently is exponential credit creation can no longer be sustained. The process of a “credit contraction” will occur in fits and starts over a long period of time as consumers, and the government, are ultimately forced to deal with the leverage and deficits. The good news is that process of “clearing” the market will eventually allow resources to be reallocated back towards more efficient uses and the economy will begin to grow again at more sustainable and organic rates.
Most importantly, the demographic and structural shift in the economy remains a major headwind to stronger rates of economic in the future.
The current levels of anemic economic growth in U.S. remain dependent upon the consumer with roughly 70% of GDP tied to personal consumption. Unfortunately, roughly 22% of personal incomes which are used to reach those consumption levels currently comes from government transfers.
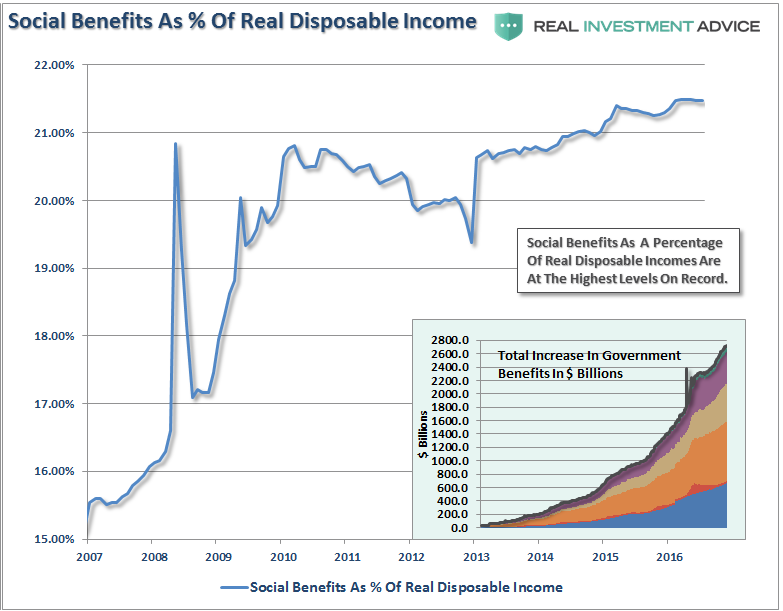
Working to reduce the governmental assistance programs, when such a large portion of personal incomes depend on it, will not be a boon to creating the economic growth needed to make the plan work in the future. The problem lies in the demographics.
With over 70 million individuals currently moving into the retirement system, this demographic shift will further complicate the net drag on savings – which are integral to productive investment and the creation of an expanding economy – as well as the increased demand on welfare and healthcare programs. While Trump has proposed reforms to these systems, which are most definitely needed to keep them viable in the long-term, the near-term impact on economic growth will most definitely be felt.
The processes that fueled the economic growth over the last 30 years are now beginning to run in reverse, and when combined with the demographic shifts in the U.S., the impact could be far more immediate and prolonged than the media, economists and analysts are currently expecting.
Again, it is simply a function of math.
