Global bond yields have moved sharply lower since the middle of July when the European Central Bank (ECB) and the Federal Reserve (FED) both indicated accommodative monetary policy was on the way. However, the sharp declines recently witnessed in bond yields may not only be about to end, but they may also be on the verge of reversing higher.
The spreads between U.S., German and Japanese bonds have been contracting, a sign that the global bond market may be coming back into alignment after reaching historic highs. Additionally, the technical chart suggests that yields in the U.S. and Germany may be on the cusp of rising.
Sharp Declines
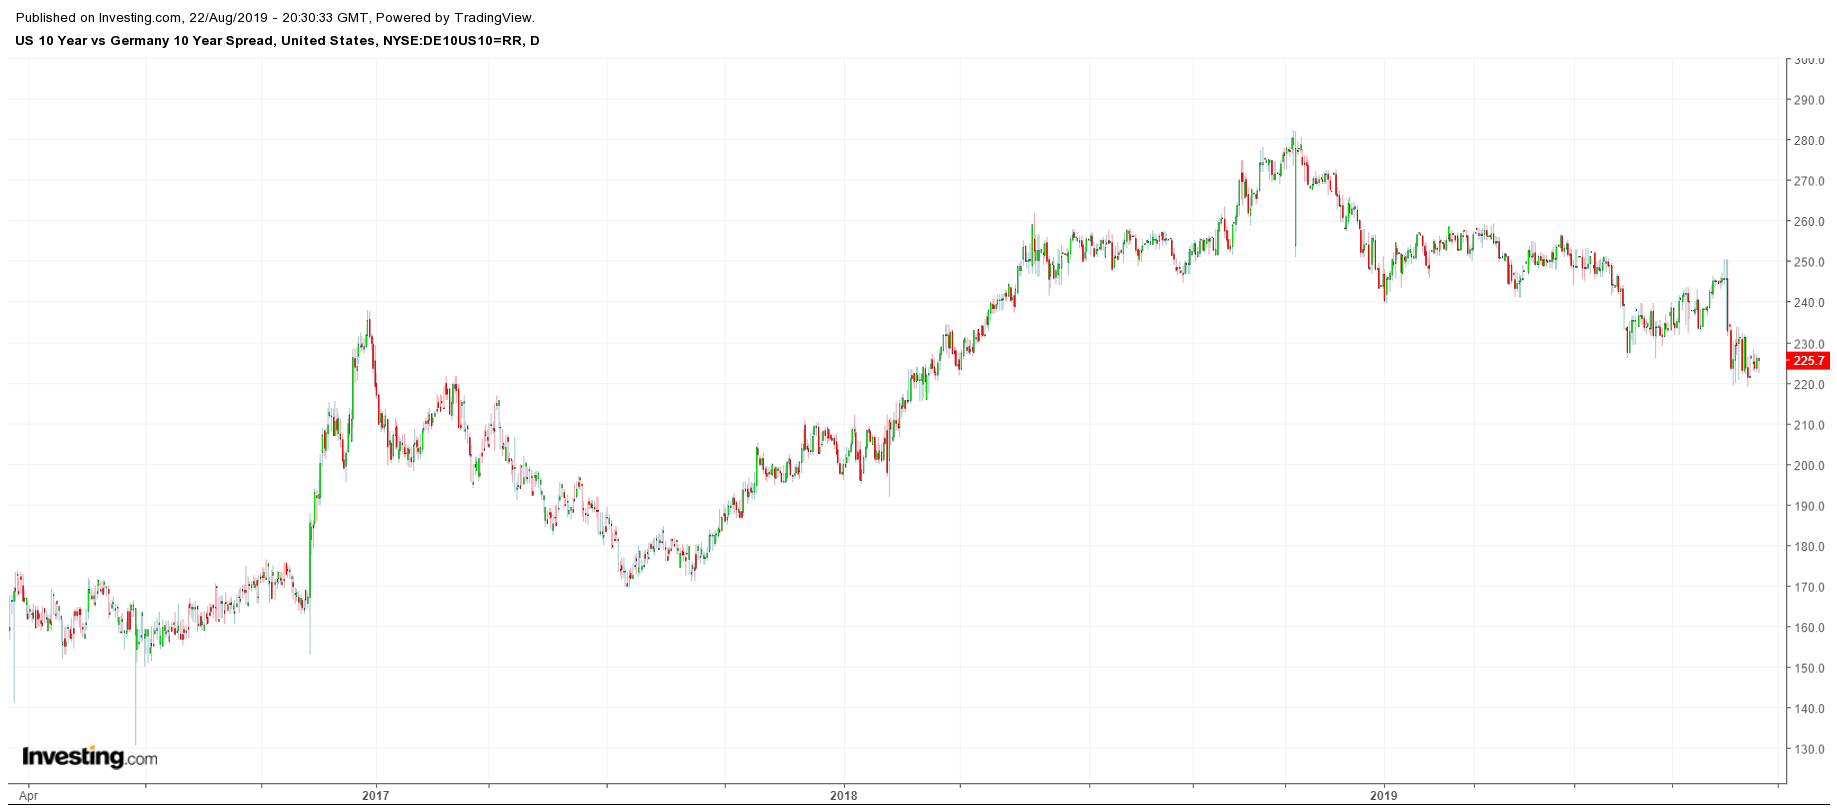
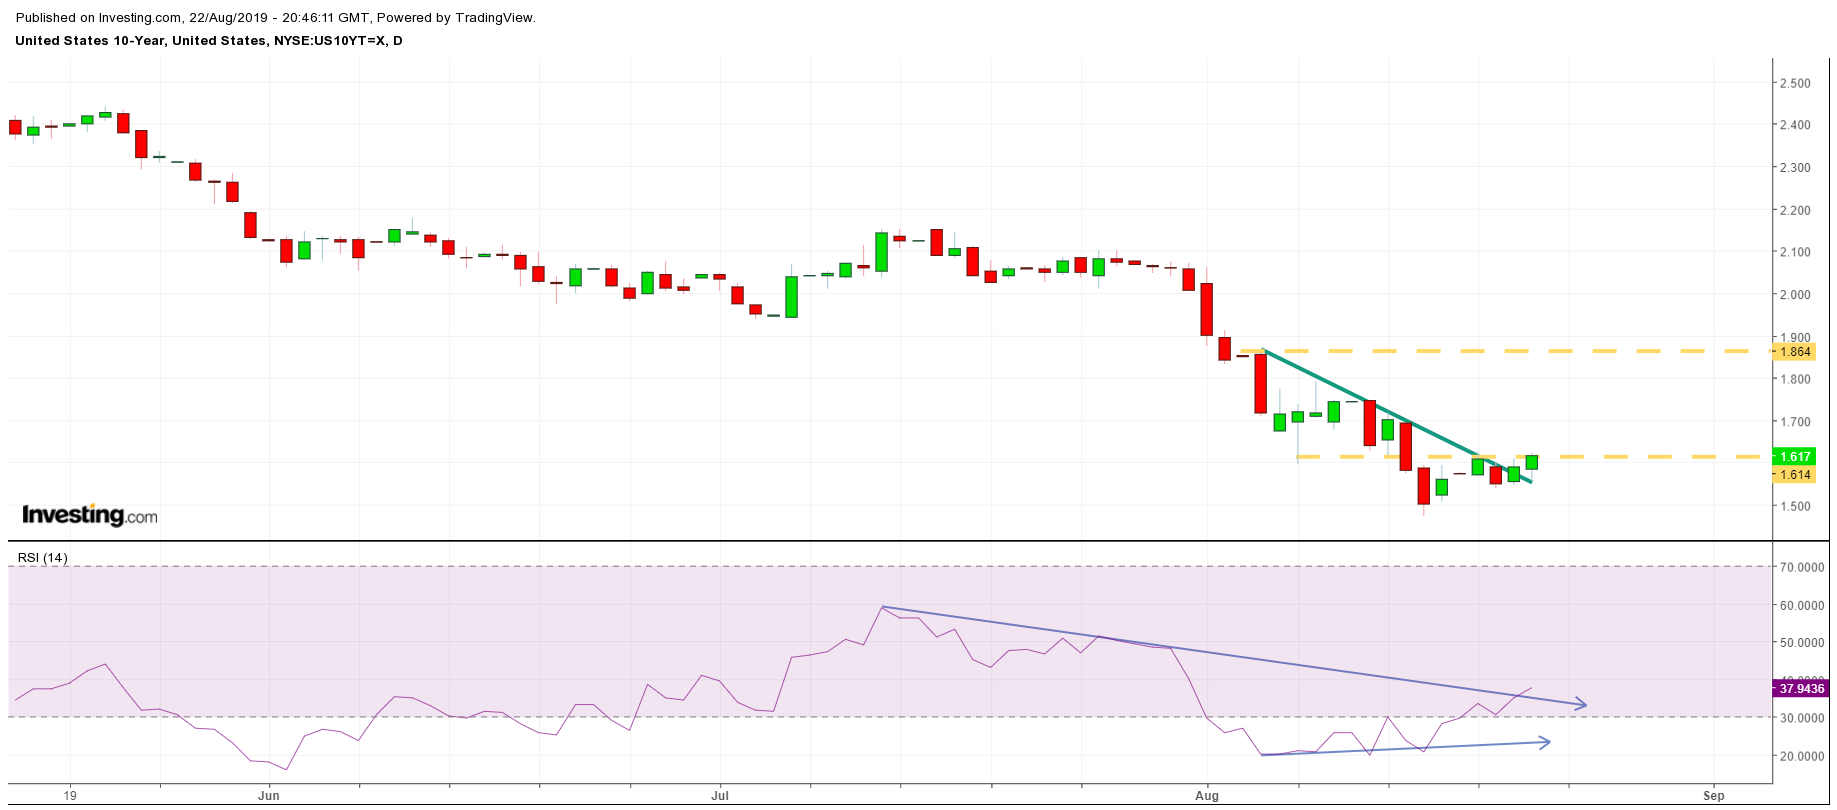
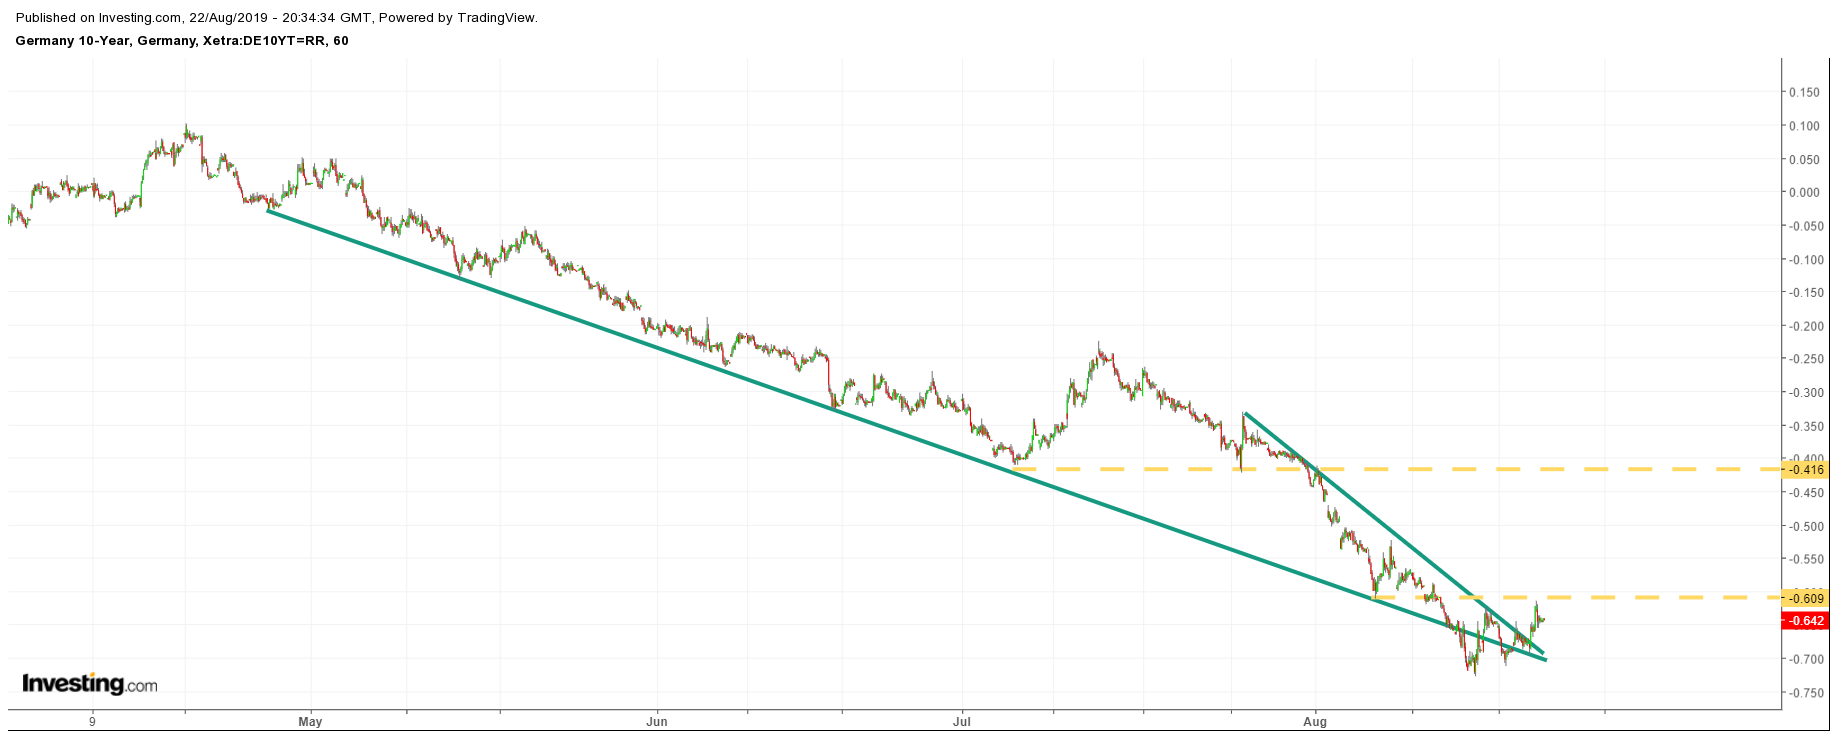
Since the middle of July, the rate on the German 10-year bund has plunged by 50 basis points reaching a low of around -0.70 basis points, a historic low. Additionally, the 10-year U.S. Treasury plunged by nearly 65 basis points to a low of roughly 1.5%. That has resulted in the spread for bonds between the U.S. and Germany to fall to 2.25% from approximately 2.40%.
The Spread
The spread between the two bonds reached a high of about 2.8% in November 2018, its widest since 1989. With the spread at near-historic levels, iU.S. bonds became attractive not only from a pure yield perspective but also based on valuation.

However, now the spread is contracting and may be set to continue shrinking, as investors rush into U.S. bonds trying to take advantage of the favorable rates. Should this happen, it would slow the rise in U.S. yields compared to the increase in German yields, thus causing the spread to contract further. There are signs now developing that would suggest that the spread may continue to contract toward 1.95%.
The same scenario has also been playing out between the U.S. and Japanese bonds in recent years. The spread between the two bonds reached their widest point since the year 2007, when they widened to roughly 3.1%—a level they reached in November 2018 as well. Now, that spread has contracted to around 1.75%, its narrowest since late 2016.
A Reversal
The technical chart shows that the U.S. 10-year yield has reached oversold levels on the relative strength index—below 30—on two occasions since June. Additionally, the RSI is now beginning to trend higher, despite the yield falling to a new low. That is known as a bullish divergence—a sign that the recent decline in yields is likely to reverse. Also, the 10-year yield has risen above a downtrend, which could result in the rate rising to around 1.80% over the next few weeks.

Another sign that yields are about to rise is the technical pattern for the German 10-year bund. That chart shows that a bullish reversal pattern known as a falling wedge has been created. It also shows that the German 10-year is nearing a potentially big breakout, should the yield rise above technical resistance at negative 60 basis points. If that happens, the rate could increase to around negative 40 basis points.

Further Contraction
If both U.S. and German yields rise, it could result in the spread between the bonds shrinking even further. The spread back to a historical alignment could suggest that the sharp decline in U.S. yields has come to an end and that global bond markets move on a more even footing going forward.
A lot, of course, will depend on just how much easing central banks provide to their respective economies. Based on current interest rates, it would seem the Fed may have a lot more room to maneuver than the ECB.
All this may suggest that the recent plunge in rates has seen its lows, at least in this cycle.
