Since the S&P 500 logged an all-time record (2130.82) 11 months ago, there have been two violent price sell-offs of more than 10%. On both occasions, the popular index rallied back to recapture the 2100 mark. Yet the unknowable question still remains; that is, will the bull market demonstrate its durability by notching a new closing high, or did U.S. stocks hit a plateau in May of 2015?
My contention is that U.S. stocks topped out last May. Primarily, the downward sloping trend of the 200-day moving average has been in place for longer than the euro-zone crisis in 2011.
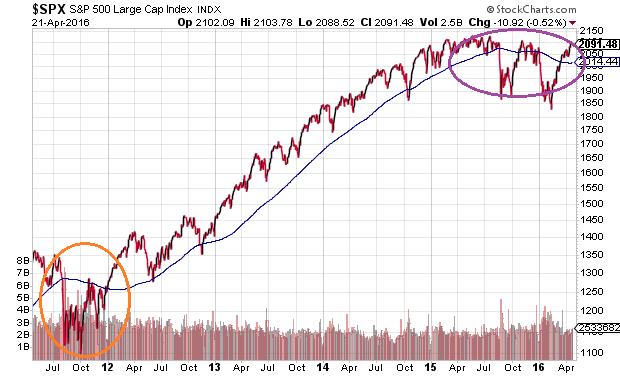
Back in the summer of 2011, however, the Federal Reserve vowed to purchase longer-maturity Treasury bonds to lower borrowing costs and to stimulate the economy. Today’s monetary stimulus bazooka? The Fed has expressed it will only raise rates twice as opposed to four times in 2016. Back then, corporate profits were still climbing. Right now? They’re still descending. In fact, for those folks who really want to analyze the difference between the quality of earnings in 2011 versus the quality of earnings in 2015, compare GAAP and non-GAAP reporting.
By the end of 2011, euro-zone fears had already subsided and stocks had practically recovered. Nevertheless, valuations were still reasonable. You could pay 15x the last twelve months of earnings. (See table below.) At this moment, an investor must be willing to pay 23.5x trailing twelve month profits per share (3/31/2016 estimate).
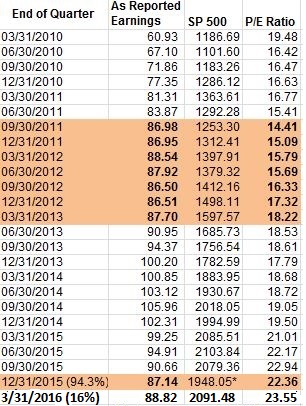
Do low interest rates really justify a P/E of 23.5? Do they justify a price-to-sales of 1.87 – a P/S ratio that has not been this out-of-whack since the tech wreck of 2000? Investors would be wise to investigate the 20-year period of ultra-low borrowing costs between 1936 and 1955 before determining that low rates override every other factor.
Let’s take a closer look at the earnings data over time. On March 31, 2012, full year S&P 500 earnings per share came in at $88.54. At the current estimate of $88.82 for the most recent quarter (3/31/2016), one is essentially getting the same profits from the index constituents today as he/she would have gotten four years earlier. The difference? Back then, you paid 1400 for those earnings whereas you currently pay close to 2100. (See table above.)
“It is the low rates that we have right now, Gary.” Unfortunately, the low borrowing cost mantra does not hold up under simple scrutiny. In fact, the 10-year yield traded at nearly the identical place four years ago. 2% on the 10-year then, 2% on the 10-Year now. Equally impressive? Stocks gained far more ground during 2012-2013 than they did during 2014-2015; average borrowing costs were higher in 2012-2013 than in 2014-2015.
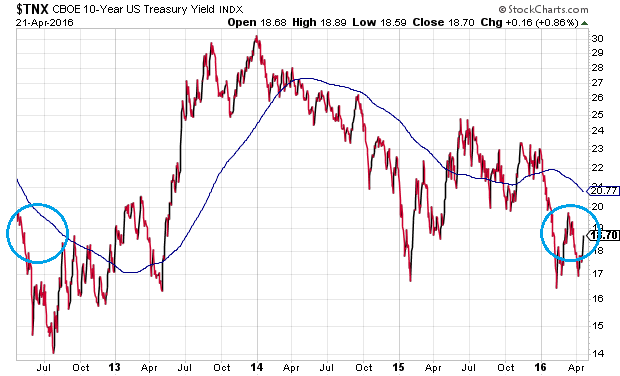
So think it through. Is gaining more exposure to the S&P 500 at 2100 with earnings per share of $88.82 justified by a 10-year yield near 2% when, four years earlier, the S&P 500 at 1400 with earnings per share of $88.54 also had a 10-year yield near 2%?
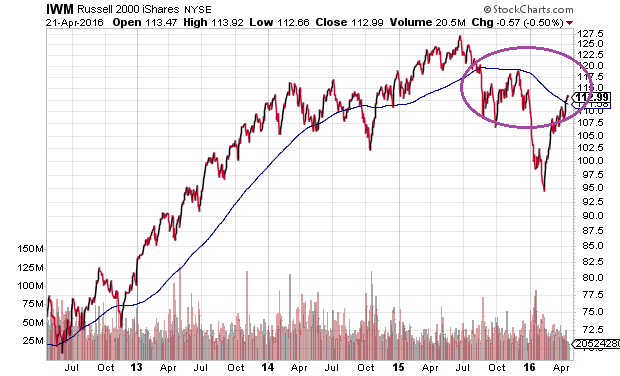
It is true that the rally off of the February lows is nothing short of amazing. It has been broad in scope with the NYSE Advance/Decline (A/D) Line eclipsing its 2015 high. There has been participation by each of the 10 economic sectors as well as participation by small-caps, mid-caps, foreign equities and junk bonds. And if I am wrong about the bear market’s May 2015 inception, the type of indiscriminate risk taking that has existed for several months might continue for many more.
On the other hand, the Russell 2000 ETF (NYSE:IWM) is far from its 2015 pinnacle; the iShares All-World ex U.S. (NASDAQ:ACWX) is nowhere near its 2014 peak. And junk bonds in SPDR High Yield Corporate (NYSE:JNK)? Recent strength notwithstanding, all three of these risky asset classes exhibit downward sloping trendlines that have more in common with equity bearishness than indiscriminate bullishness.
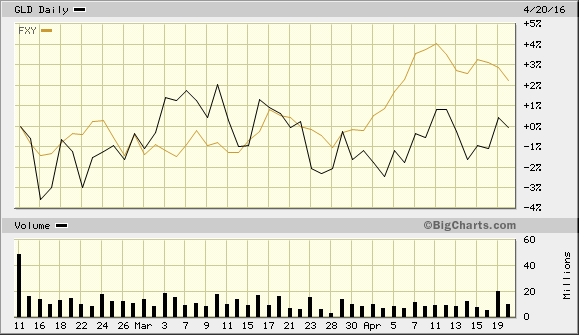
Finally, if we are genuinely seeing the revival of the cyclical bull, in spite of exorbitant valuations, why have prominent “risk off” assets gained or maintained favor since the February lows? Specifically, one would anticipate some deterioration in demand for the SPDR Gold Trust (NYSE:GLD) and/or the CurrencyShares Yen Trust (NYSE:FXY). On the contrary. Both “risk off” assets have held up unusually well in the 14%-plus rocket-like climb out of the pits by the S&P 500.
Disclosure: Gary Gordon, MS, CFP is the president of Pacific Park Financial, Inc., a Registered Investment Adviser with the SEC. Gary Gordon, Pacific Park Financial, Inc, and/or its clients may hold positions in the ETFs, mutual funds, and/or any investment asset mentioned above. The commentary does not constitute individualized investment advice. The opinions offered herein are not personalized recommendations to buy, sell or hold securities. At times, issuers of exchange-traded products compensate Pacific Park Financial, Inc. or its subsidiaries for advertising at the ETF Expert web site. ETF Expert content is created independently of any advertising relationships.
