It is time go look at a positive development of the government shutdown – no BLS Jobs Report on Friday. This report is dangerous in real time.
The financial world holds its breath on the first Friday of each month, and reacts strongly to the data release. Is it logical? – no because employment is a lagging indicator, and the markets are forward looking. Further, employment growth is an average of economic pressures seen during the previous six months.
The BLS warns us to take this report with a grain of salt.
For example, the confidence interval for the monthly change in total nonfarm employment from the establishment survey is on the order of plus or minus 90,000. Suppose the estimate of nonfarm employment increases by 50,000 from one month to the next. The 90-percent confidence interval on the monthly change would range from -40,000 to +140,000 (50,000 +/- 90,000). These figures do not mean that the sample results are off by these magnitudes, but rather that there is about a 90-percent chance that the true over-the-month change lies within this interval.
What financial person would react to data that could have this kind accuracy range? Only those who have ability to push short term market movements. The rest of us should ignore the number when it is announced, especially when it comes to making investment decisions. Of course, it you are a day trader and can trade hourly market swings then this is as good a pulse to trade as any.
As it turns out, the BLS reports have been well within its reported accuracy range – and have been generally on the low side compared to the current estimates.
Figure 1 – Non-Farm Private Jobs Growth – Originally Reported (blue bars, left axis), Currently Estimated (red line, left axis), and Percent Change from the Originally Reported Gain (yellow line, right axis) 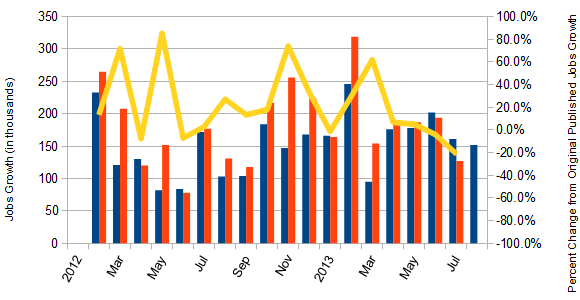
Until 2013, BLS seemed to be continuously underestimating the jobs growth – and 2013 started with continued underestimations but has recently been overestimating. One positive on the BLS methodology is that the three month trends are unchanged whether one looks at the original or current data.
Figure 2 – 3 month Rolling Average Non-Farm Private Job Gains (in thousands) – Originally Stated (green line) and Current Estimate (red line)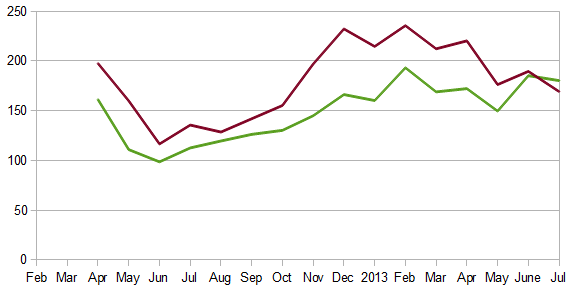
In any event the BLS 3-month trend rate of growth is declining. In comparison, the ADP trend was improving for four months until their September jobs report where the trend rolled over. I do not trust the ADP report because it has not yet proven itself reliable after the change in methodology in October 2012. But it would seem likely that the BLS will eventually report the jobs growth for September at over 150,000.
Figure 3 – Comparisons between the ORIGINALLY posted jobs growth – BLS (blue line) and ADP (red line)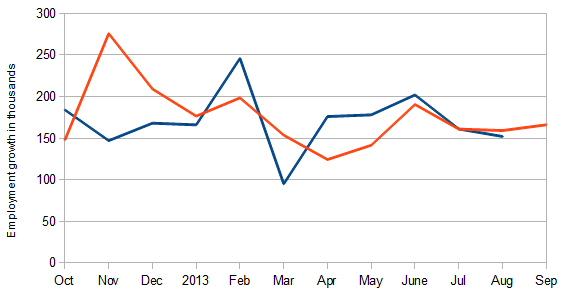
In any event, Econintersect sees economic pressures that influence jobs growth as declining. The Econintersect Jobs Index is forecasting non-farm private jobs growth of 160,000 for September.
Comparing BLS Non-Farm Employment YoY Improvement (blue line, left axis) with Econintersect Employment Index (red line, left axis) and The Conference Board ETI (yellow line, right axis)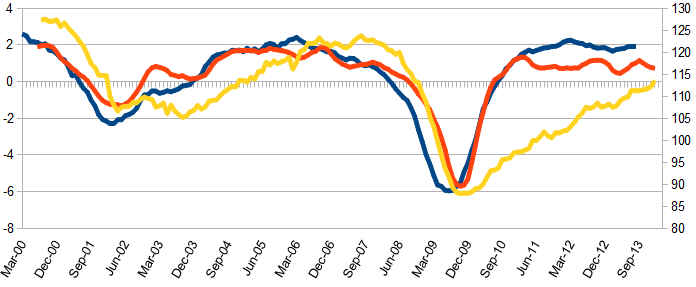
So the market likely missed seeing a soft data report on Friday. And this is a good thing for a market already under pressure from Congressional mismanagement.
Other Economic News this Week:
The Econintersect economic forecast for October 2013 again improved and it appears an improving cycle has begun. There is no indication the cycle is particularly strong, as our concern remains that consumers are spending a historically high amount of their income, and the rate of gain on the points we watch are not very strong.
The ECRI WLI growth index value has been weakly in positive territory for over four months – but in a noticeable improvement trend. The index is indicating the economy six month from today will be slightly better than it is today.
Current ECRI WLI Growth Index 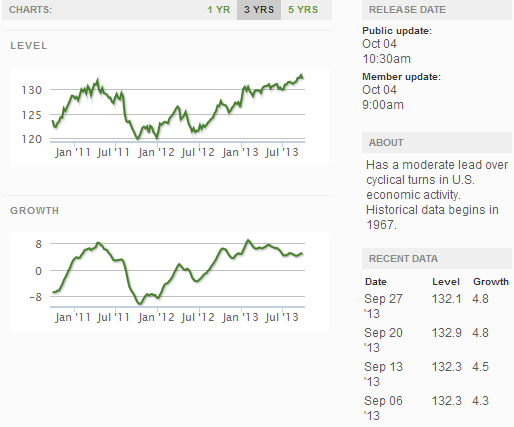
Initial unemployment claims went from 305,000 (reported last week) to 308,000 this week. Historically, claims exceeding 400,000 per week usually occur when employment gains are less than the workforce growth, resulting in an increasing unemployment rate.
The real gauge – the 4 week moving average – improved from 308,000 (reported last week) to 305,000. Because of the noise (week-to-week movements from abnormal events AND the backward revisions to previous weeks releases), the 4-week average remains the reliable gauge.
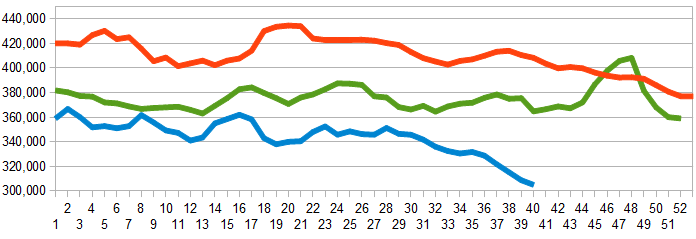
Weekly Initial Unemployment Claims – 4 Week Average – Seasonally Adjusted – 2011 (red line), 2012 (green line), 2013 (blue line)
Bankruptcies this Week: GateHouse Media (aka Liberty Group Publishing), Fresh & Easy Neighborhood Market, Teletouch Communications
Data released this week which contained economically intuitive components(forward looking) were:
- Rail movements growth trend is continuing to accelerate.
All other data released this week either does not have enough historical correlation to the economy to be considered intuitive, or is simply a coincident indicator to the economy.
Weekly Economic Release Scorecard
Click here to view the scorecard table below with active hyperlinks

