Get 40% Off
🚨 Volatile Markets? Find Hidden Gems for Serious Outperformance
Find Stocks Now

Why January Trade Trend For 2020 Is Critical

Published 12/30/2019, 12:21 AM
Updated 07/09/2023, 06:31 AM

The Dow, the SPY, and the QQQ all hit new all-time highs up another +.75% on average and look frothy.

Emerging markets and precious metals broke out of classic chart patterns to the upside and look poised for more.

The big question confronting the markets is whether the Federal Reserve and the Central Banks of the world are losing control and the next phase is an inflationary spiral.

This, of course, would at some point put intense pressure on the Central Banks to increase rates and tank the equities markets globally.

This week’s highlights:

  • Risk Gauges backed off yet again to a neutral reading
  • US Equities made new all-time highs
  • Volatility (VXX) refused to follow the froth and closed higher
  • Growth continues to lead Value stocks with the relative performance of value stocks at decade-plus lows
  • Gold, Silver and Gold miners all broke out of a multi-month trading patterns
  • Emerging markets broke out of a major base
  • As we hit new all-time highs this week in three benchmark indexes (DIA, SPY and QQQ) we are also trading at extremes of momentum as we enter the new year and decade.
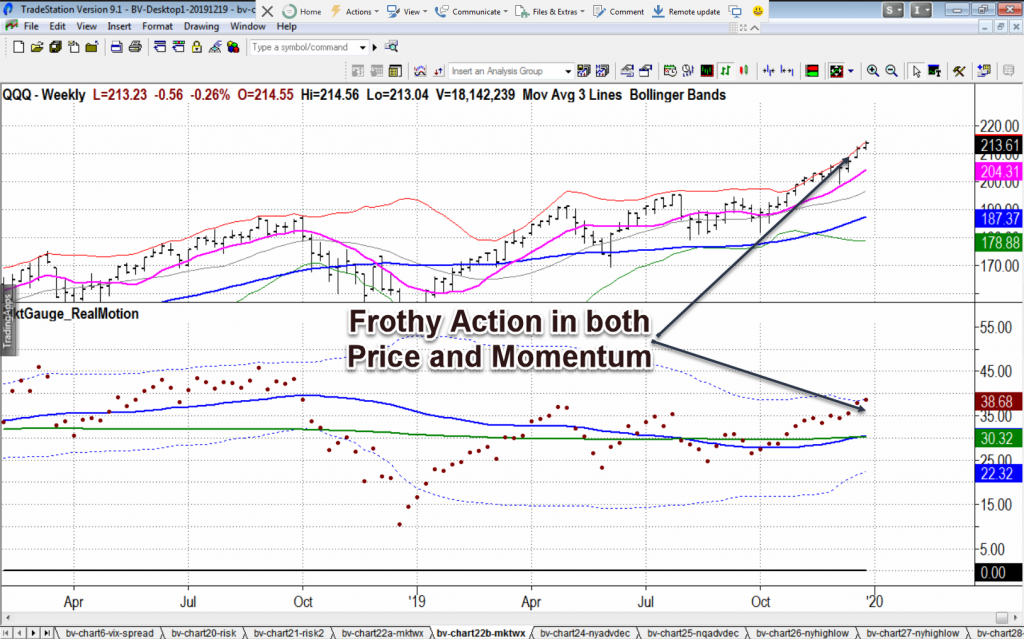
    QQQ Weekly Chart

    The market narratives that have been in place for the past 9 years often reverse as we enter a new decade, and new macro themes appear. The keyword is “often” so one must be prepared for any outcome, use solid methods based on the stats with a risk overlay. That means, let the market action determine the game plan with complete flexibility.

    3rd party Ad. Not an offer or recommendation by Investing.com. See disclosure here or remove ads .

    It has never been more critical as the market could be construed to be at an extreme. Looking at the big picture, one could point to Warren Buffet, who is sitting on a 128 billion cash hoard (as of November 4, 2019) as a sign of just how much the market is overvalued. Buffet’s key metric which looks at the ratio of the GDP versus the stock market’s value is more inflated than in 2000, just before the meltdown.

    In fact, based on this metric, US stocks are projected to yield -2.9% a year from this valuation after dividends.

    On the other hand, one could look at the current picture and certainly see US equities at all-time highs with market phases intact on all time frames, poised for more upside and a melt-up.

    Latest comments

    Risk Disclosure: Trading in financial instruments and/or cryptocurrencies involves high risks including the risk of losing some, or all, of your investment amount, and may not be suitable for all investors. Prices of cryptocurrencies are extremely volatile and may be affected by external factors such as financial, regulatory or political events. Trading on margin increases the financial risks.
    Before deciding to trade in financial instrument or cryptocurrencies you should be fully informed of the risks and costs associated with trading the financial markets, carefully consider your investment objectives, level of experience, and risk appetite, and seek professional advice where needed.
    Fusion Media would like to remind you that the data contained in this website is not necessarily real-time nor accurate. The data and prices on the website are not necessarily provided by any market or exchange, but may be provided by market makers, and so prices may not be accurate and may differ from the actual price at any given market, meaning prices are indicative and not appropriate for trading purposes. Fusion Media and any provider of the data contained in this website will not accept liability for any loss or damage as a result of your trading, or your reliance on the information contained within this website.
    It is prohibited to use, store, reproduce, display, modify, transmit or distribute the data contained in this website without the explicit prior written permission of Fusion Media and/or the data provider. All intellectual property rights are reserved by the providers and/or the exchange providing the data contained in this website.
    Fusion Media may be compensated by the advertisers that appear on the website, based on your interaction with the advertisements or advertisers.
    © 2007-2024 - Fusion Media Limited. All Rights Reserved.