The root cause of the current carnage in markets across all asset classes is a lot different than during previous corrections, risk-off conditions, or even black swan events. Since the end of February, the world has faced a whale of a problem in the form of a faceless enemy to humanity, coronavirus. While the virus continues to infect people around the globe, the world financial system and markets across all asset classes have caught a bad case of the infection. Economic activity has ground to a halt on a worldwide basis.
The natural gas market is now moving from the time of year when inventories flow out of storage during the cold winter months to the injection season when stockpiles build. We are heading into the 2020 injection season with the highest level of inventories in many years. At the same time, demand for all energy products has fallen off the edge of a bearish cliff.
The price of crude oil on the NYMEX division of the CME fell from $65.65 on January 8 to below $21 per barrel at the end of last week. The glut in natural gas is likely to continue for a time. However, it could be setting the stage for a shortage in the future.
One of the most volatile commodities
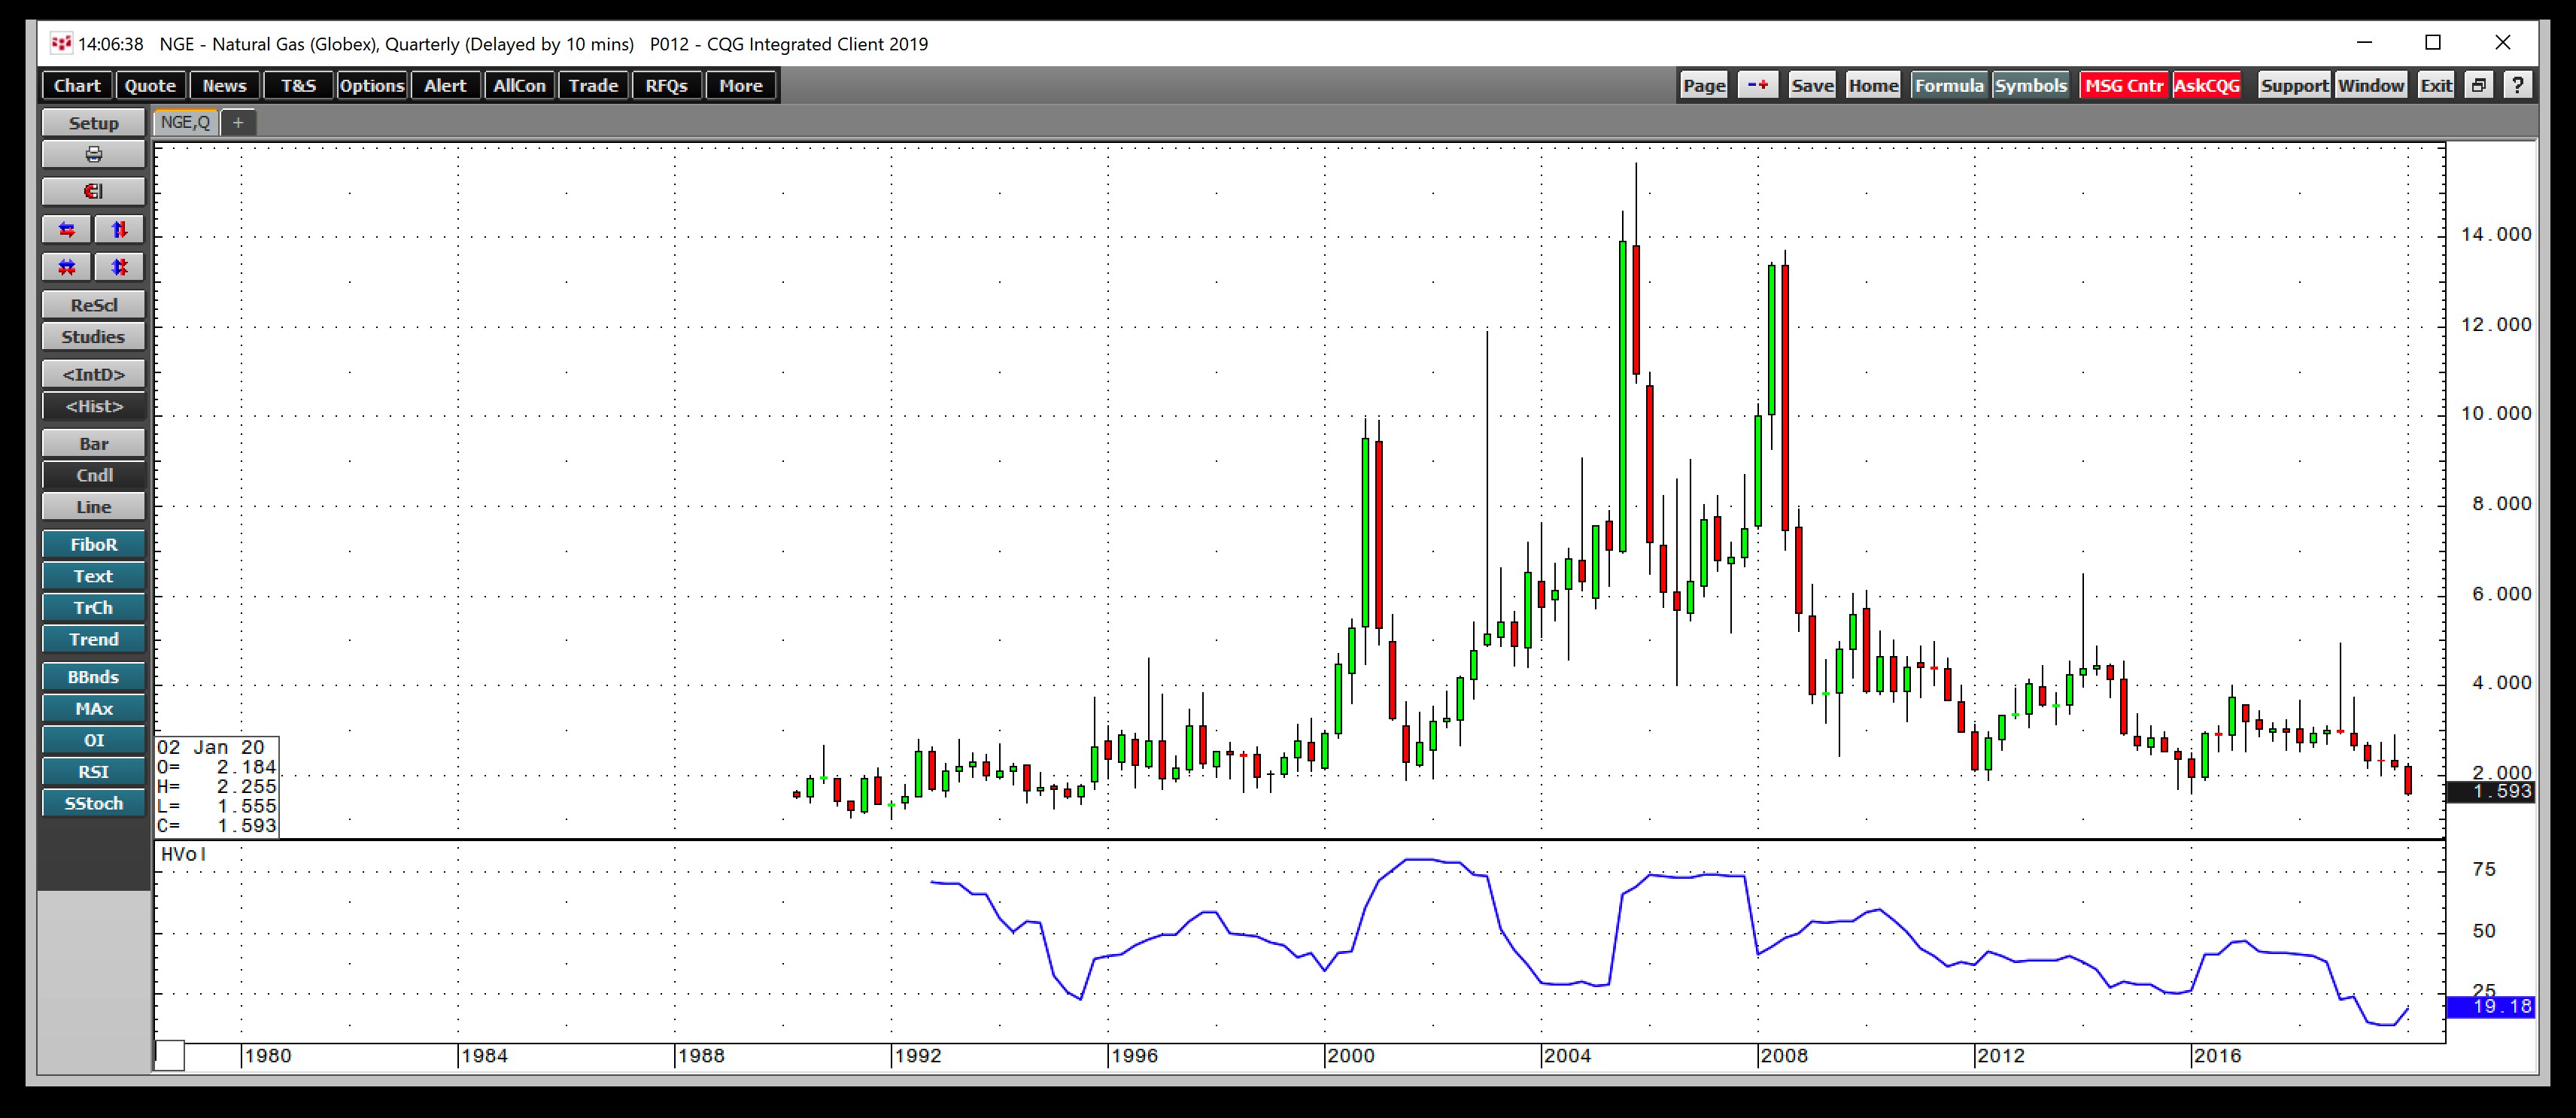
The price of natural gas has a long history as one of the world’s most volatile energy products. Since trading in natural gas futures began in 1990, the contracts on the NYMEX division of the CME have traded as low as $1.02 and as high as $15.65 per MMBtu. The price of natural gas has doubled, tripled, and halved in value at times over the past three decades. In 2018, the price moved from a low of $2.53 in February to a high of $4.929 per MMBtu in November. The low came towards the end of the peak season for demand. The high was at the beginning of the time of the year when stockpiles fall during the winter months.
A sea of calm compared to other markets led to a new low
As markets across all asset classes were plunging, natural gas had been making lower highs and lower lows since trading at a pre-winter season peak of $2.905 in early November 2019. Stockpiles of the energy commodity were at far higher levels in late 2019 compared to the same time in 2018, which kept a lid on the price. Warm conditions throughout most of the winter kept inventory withdrawals at low levels. Throughout the entire winter season, stockpiles withdrawals only fell by over 200 billion cubic feet once, in January. In March, while crude oil, stocks, and other markets plunged, natural gas made a lower low, but the price damage on the downside had occurred throughout the peak season.

As the quarterly chart highlights, the price dropped to a low of $1.555 per MMBtu, the lowest level since way back in 1995 when it hit a low of $1.335, the next technical level on the downside. Below there, $1.25 and $1.02 stand as levels of technical support in an environment where technical analysis goes out the window. Quarterly historical volatility at below the 20% level is a lot closer to lows than highs over the past thirty years, which makes natural gas stand out as a sea of calm during these turbulent times.
Natural gas companies in trouble
The price of natural gas and oil have declined to the lowest level in years as demand destruction, and supply gluts create a potent bearish cocktail for the energy commodities. Debt-laden natural gas producers face an environment where the price of the energy commodity has dropped to a level where production becomes a losing proposition. Meeting debt-servicing requirements will become impossible.
The U.S. is the world’s leading producer of natural gas. The government will likely consider energy a matter of national security, and bailouts are on the horizon for the leading producers. However, equity holders could be left in the dust as a bailout will help on the debt side, but the value in the shares of many energy companies could evaporate to zero.
Meanwhile, it is not all doom and gloom for the natural gas market. The highest stockpile level in years going into the 2020 injection season and demand destruction the likes of which the world may have never witnessed with economic activity grinding to a halt will cause production to decline dramatically. Eventually, inventories will begin to fall, and the price of natural gas will reach a significant bottom. At that point, shortages are likely to develop, which could light a fuse under the price of natural gas. The economic fallout after scientists develop treatments, and a vaccine for Coronavirus will be unprecedented. The longer it takes, the deeper the financial hole. The current glut could lead to a significant shortage of natural gas, but the chances are we have not yet seen the low. The only thing to remember is that at $1.604 on March 20, the price can only drop by that much.
The United States Natural Gas Fund L.P. (NYSE:UNG) closed at $13.21 per share on Tuesday up $0.56 (+4.43%). Year-to-date, UNG has declined -43.48%, versus a -10.05% rise in the benchmark S&P 500 index during the same period.
