Stocks bounced back last Friday, with all main stock market indexes posting gains of at least 0.9%. However, total volume was significantly lighter across the board, signaling a lack of buying interest amongst banks, mutual funds, hedge funds, and other institutions. Last week’s back to back distribution days (February 20 and 21) in the S&P 500 remains a clear warning sign for the bulls. The broad market really is not yet dead, but one or two more distribution days this week to early next week would more than likely end the rally and generate a new bearish signal in our stock market timing system.
How will the market act this week? Will the S&P 500 and Nasdaq recover by rallying above their prior swing highs on heavy volume, or will the indexes stall out after a light volume bounce and roll over to new swing lows? We do not know, as we do not operate with a crystal ball (nor does anyone else). However, it frankly doesn’t matter to us either way. This is because we always prefer to pick stocks and ETFs by simply reacting to actual price and volume patterns in the market, rather than attempting to predict what will happen.
Overall, we plan to lay low for at least the next few days, in order to see how the market reacts to last week’s selling. Nevertheless, we remain prepared for a a sudden shift in either direction. As such, today’s ETF commentary will focus on two potential swing trade picks: one bullish technical chart pattern ($IBB) and one bearish pattern ($XME).
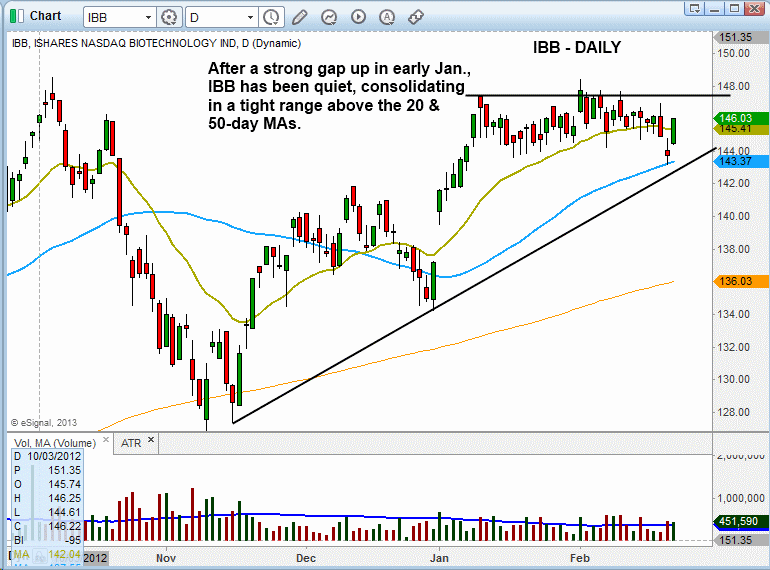
After showing market leadership throughout 2011 and much of 2012, iShares NASDAQ Biotechnology Index (IBB) has spent the past few months digesting gains and building a new base above long-term support of its 200-day moving average. Over the past few weeks, price action has been quiet and volatility has been low, with the price trading in a tight range near the highs of the base:
Although money rotated out of $IBB in the fourth quarter of 2012, the price action has recovered nicely. As such, this sector could be back in play soon. With a bit of help from the broad market, $IBB could soon see a volatility expansion and breakout above the highs of the range (above the $148 level). We might be able to establish a small position before the obvious breakout level if the price action forms a higher swing low. However, with the broad market rally losing steam, we are in no rush to establish new long positions.
In case the market does break down, we ran a relative weakness scan over the weekend to identify groups and sectors that have underperformed during the past 6 months. There isn’t much out there in terms of clear-cut short selling setups for ETF or stock picks within specific industry groups, as most sectors are in line with the S&P 500. Gold commodity & gold stocks especially have taken a beating lately; however, if market conditions continue to weaken, we could see buying interest in gold.
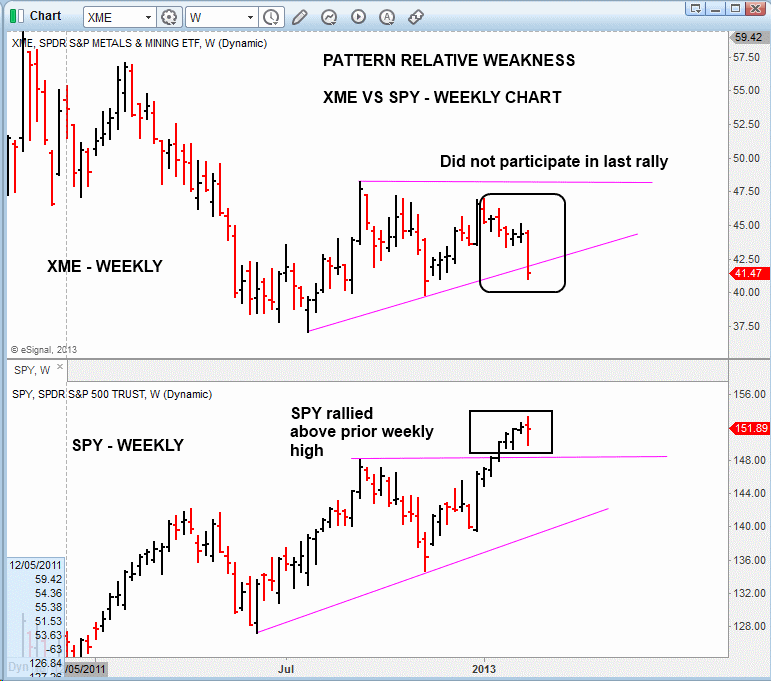
SPDR S&P Metals and Mining ETF (XME) has also been showing relative weakness, as it has failed to keep pace with the broad market rally in recent months. This can be easily observed on the weekly chart below, which shows the bearish divergence of XME compared to the S&P 500: 
XME does have a bit of exposure to gold, but the majority of its underlying portfolio is related to the steel sector, which has not been acting well and broke down below the 50-day moving average last week (check out Market Vectors Steel ETF – SLX). Note that XME is currently not actionable based on our rule-based stock trading strategy, but we will continue to monitor overall market action for a possible low-risk entry point on the short side if the market breaks down.
The above commentary is a shortened version of the February 25 issue of The Wagner Daily, our nightly swing trading newsletter with detailed ETF and stock picks of the best technical trading setups.
Original post
- English (UK)
- English (India)
- English (Canada)
- English (Australia)
- English (South Africa)
- English (Philippines)
- English (Nigeria)
- Deutsch
- Español (España)
- Español (México)
- Français
- Italiano
- Nederlands
- Português (Portugal)
- Polski
- Português (Brasil)
- Русский
- Türkçe
- العربية
- Ελληνικά
- Svenska
- Suomi
- עברית
- 日本語
- 한국어
- 简体中文
- 繁體中文
- Bahasa Indonesia
- Bahasa Melayu
- ไทย
- Tiếng Việt
- हिंदी
Why It Doesn’t Matter If Stocks Follow Through On Last Week’s Selling
Published 02/26/2013, 03:01 AM
Updated 07/09/2023, 06:31 AM
Why It Doesn’t Matter If Stocks Follow Through On Last Week’s Selling
3rd party Ad. Not an offer or recommendation by Investing.com. See disclosure here or
remove ads
.
Latest comments
Install Our App
Risk Disclosure: Trading in financial instruments and/or cryptocurrencies involves high risks including the risk of losing some, or all, of your investment amount, and may not be suitable for all investors. Prices of cryptocurrencies are extremely volatile and may be affected by external factors such as financial, regulatory or political events. Trading on margin increases the financial risks.
Before deciding to trade in financial instrument or cryptocurrencies you should be fully informed of the risks and costs associated with trading the financial markets, carefully consider your investment objectives, level of experience, and risk appetite, and seek professional advice where needed.
Fusion Media would like to remind you that the data contained in this website is not necessarily real-time nor accurate. The data and prices on the website are not necessarily provided by any market or exchange, but may be provided by market makers, and so prices may not be accurate and may differ from the actual price at any given market, meaning prices are indicative and not appropriate for trading purposes. Fusion Media and any provider of the data contained in this website will not accept liability for any loss or damage as a result of your trading, or your reliance on the information contained within this website.
It is prohibited to use, store, reproduce, display, modify, transmit or distribute the data contained in this website without the explicit prior written permission of Fusion Media and/or the data provider. All intellectual property rights are reserved by the providers and/or the exchange providing the data contained in this website.
Fusion Media may be compensated by the advertisers that appear on the website, based on your interaction with the advertisements or advertisers.
© 2007-2024 - Fusion Media Limited. All Rights Reserved.
