
A month has gone by since the last earnings report for Valmont Industries, Inc. (NYSE:VMI) . Shares have lost about 6% in that time frame, underperforming the market.
Will the recent negative trend continue leading up to the stock's next earnings release, or is it due for a breakout? Before we dive into how investors and analysts have reacted of late, let's take a quick look at the most recent earnings report in order to get a better handle on the important catalysts.
Valmont's Q2 Earnings and Revenues Beat Estimates
Valmont posted a profit of roughly $45.7 million or $2.01 per share in second-quarter 2017, up 9% from net earnings of around $42 million or $1.85 a year ago. Earnings for the reported quarter beat the Zacks Consensus Estimate of $1.93.
Net sales for the quarter were $712.7 million, up 11% year over year. The figure also surpassed the Zacks Consensus Estimate of $666.2 million. Revenues rose across all segments except Energy & Mining.
Segment Review
Broadly, the Omaha, NE-based company classifies its business segments as infrastructure- and agriculture-related.
Infrastructure-Related
Engineered Support Structures: The segment’s sales of $217.6 million for the reported quarter were 7% higher than the prior-year quarter, helped by increased intersegment sales to the Utility Support Structures Segment and higher wireless communication product sales in North America. Lighting sales fell modestly in North America and Europe, partly offset by increase in the Asia-Pacific region.
Utility Support Structures: Sales rose 22% year over year to $184.6 million owing to volume increases and certain pricing tied to increased steel costs. The ongoing expansion of the North America grid to improve its reliability and capacity also acted as a supporting factor.
Coatings: This segment recorded net sales growth of 6%year over year to $79.8 million, on the back of increased activity in the Asia-Pacific region. Sales in North America improved due to the new facility in Texas and increased internal volumes to other segments, which partly offset reduced external demand.
Energy and Mining: Net sales fell 4% to $77.2 million due to a decline in sales of access systems. Expansion into markets outside of mining and energy has helped to lower the impact of lower demand from markets exposed to oil and gas that weakened during the quarter.
Agriculture-Related
Irrigation: The segment reported net sales of $188.3 million, up 24% year over year. Sales in the North American market increased significantly due to improved demand from markets outside the traditional corn-belt while international sales improved broadly on the back of a stronger Brazil market and project demand.
Financial Position
Valmont ended second-quarter 2017 with a cash balance of $448.2 million, up roughly 30.2% year over year. Long-term debt at the end of the quarter was $754.4 million, down around 0.3% year over year.
Outlook
The company reaffirmed its annual guidance for earnings that is expected to be slightly above $7 per share. Valmont anticipates strong demand in the utility market.
In Engineered Support Structures, the company expects improvement in the second half in response to moderating steel costs along with price recovery. Demand is anticipated to be stable in the coatings segment. The company continues to expect challenges in the Energy and Mining segment caused by difficult end market demand.
For the Irrigation segment, the company relies on its international presence to contribute to its second-half irrigation results. Valmont expects normal seasonality in the third quarter in North America while the fourth quarter will have to depend on crop prices and farmers’ sentiment post the growing season.
How Have Estimates Been Moving Since Then?
Analysts were quiet during the last one month period as none of them issued any earnings estimate revisions.
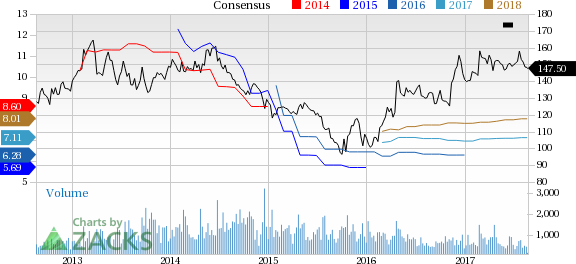
Valmont Industries, Inc. Price and Consensus
VGM Scores
At this time, Valmont's stock has a poor Growth Score of F, however its Momentum is doing better with a C. Charting a somewhat similar path, the stock was allocated a grade of C on the value side, putting it in the middle 20% for this investment strategy.
Overall, the stock has an aggregate VGM Score of D. If you aren't focused on one strategy, this score is the one you should be interested in.
The company's stock is equally suitable for value and momentum investors based on our styles scores.
Outlook
Notably, the stock has a Zacks Rank #3 (Hold). We expect in-line returns from the stock in the next few months.
Valmont Industries, Inc. (VMI): Free Stock Analysis Report
Original post
Zacks Investment Research