
Natural gas was threatening to test the March low as the Energy Information Administration released its latest inventory data on Thursday, June 25. The July futures contract rolled to August slipped below the $1.70 level for the first time on June 16.
The downside target was the March 2020 low at $1.519, the lowest price for natural gas futures since back in 1995. In early May, a recovery that took August futures to a high of $2.447 per MMBtu ran out of steam on the upside and sent the price of the energy commodity almost 90 cents lower. The lowest price NYMEX natural gas for delivery at the Henry Hub in Erath, Louisiana, ever reached since it began trading in 1990, was $1.02 per MMBtu in early 1992. This year, crude oil fell into negative territory, so it is a period where nothing is off the table in the energy sector.
The United States Natural Gas Fund (NYSE:UNG) moves higher and lower with the price of natural gas futures. The UGAZ and DGAZ triple leveraged ETNs are instruments that magnify the price action is the already volatile commodity.
The market expected a 99 bcf injection
On Thursday, June 25, the EIA told markets that natural gas inventories increased by 120 billion cubic feet for the week ending on June 19, 2020. According to Estimize, the crowdsourcing website, the consensus estimate was for a lower injection into storage across the United States.
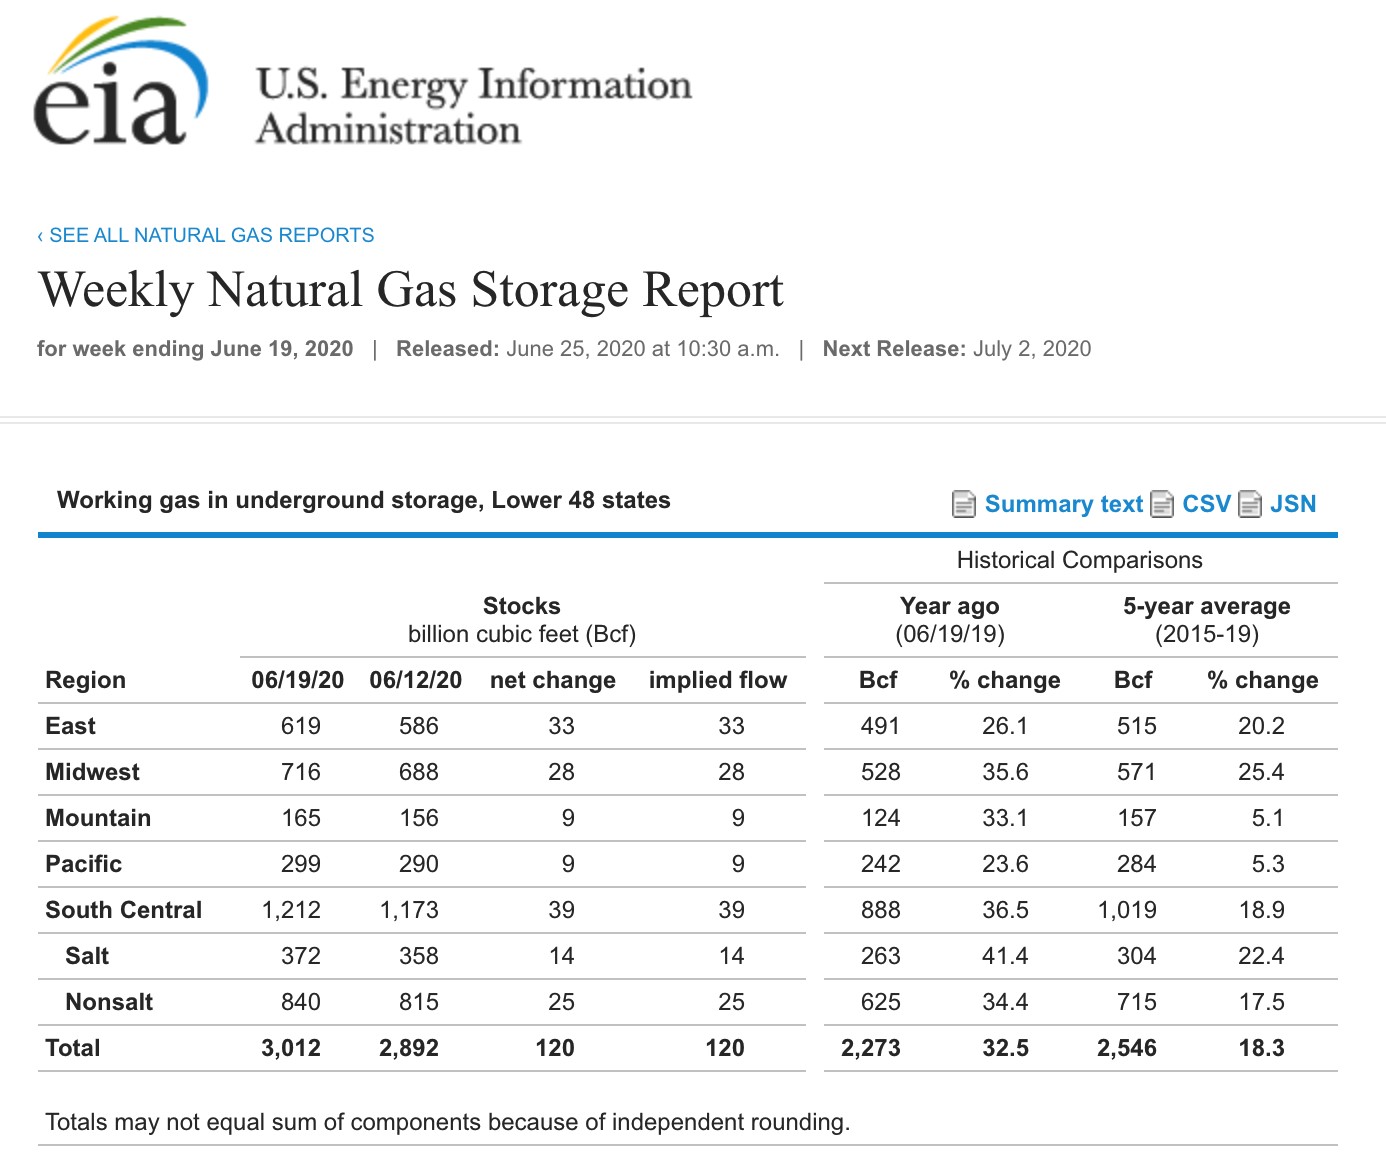
Source: EIA
The chart shows that the increase in natural gas stockpiles brought total supplies to 3.012 trillion cubic feet for the week ending on June 19, 2020. Stocks were 32.5% above last year’s level and 18.3% higher than the five-year average for this time of the year.
The report was bearish for the price of the energy commodity, buy the August futures limped into the EIA’s latest weekly report.
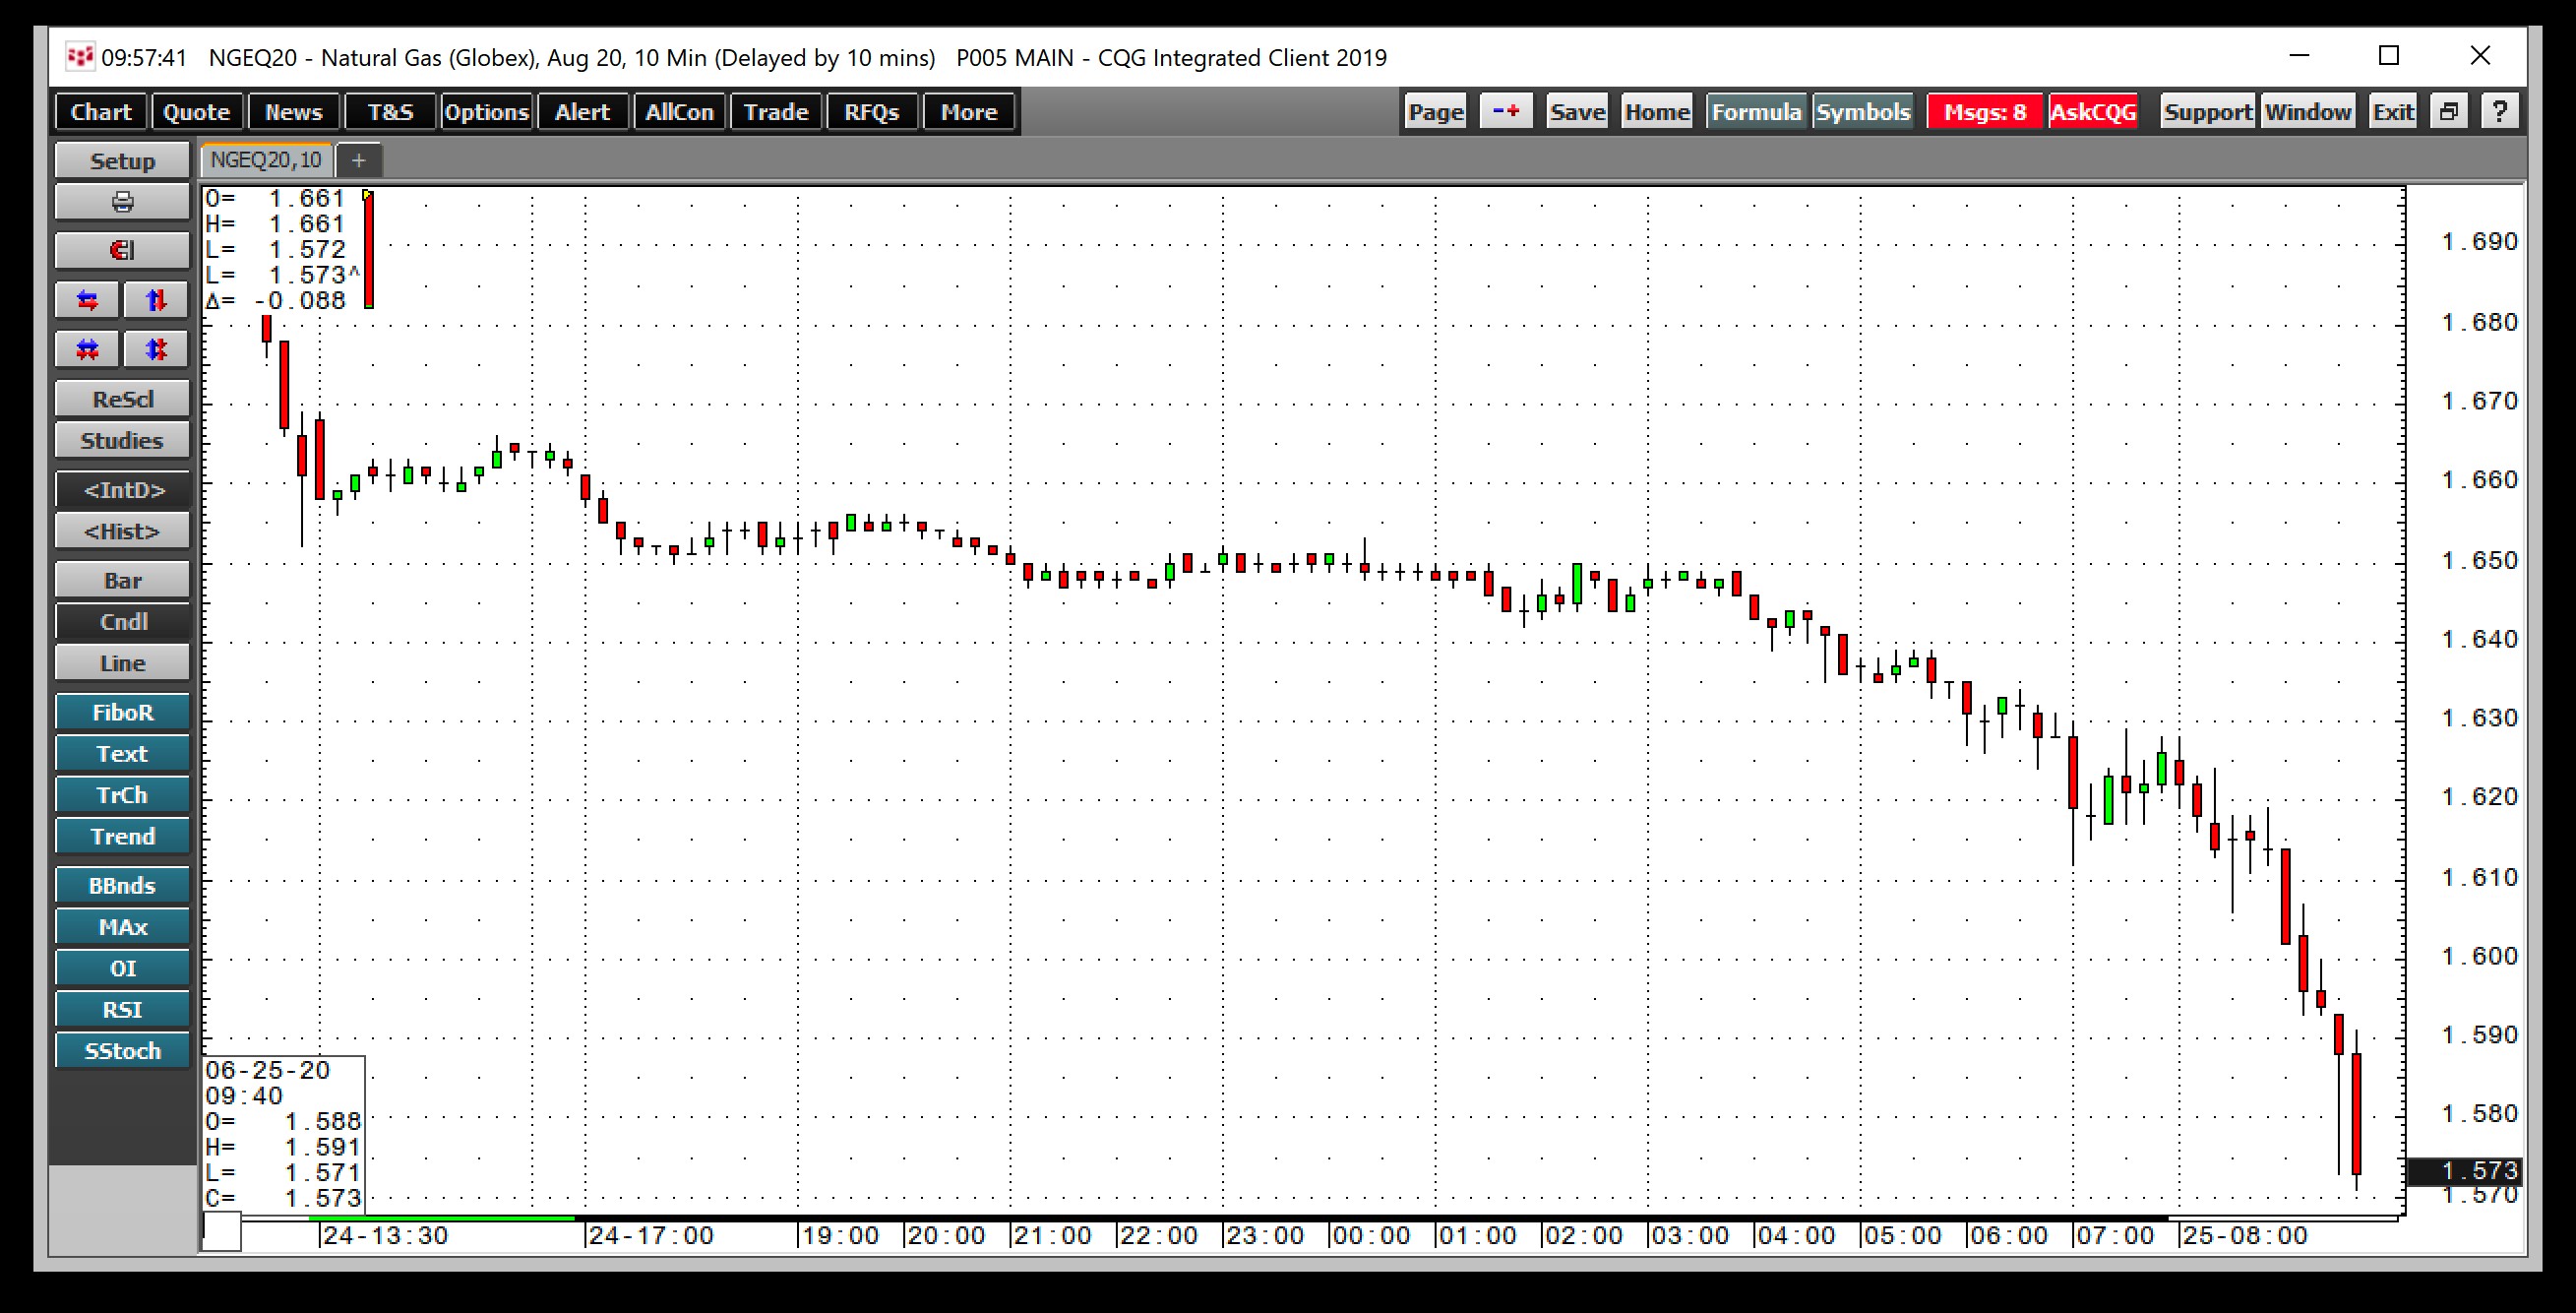
Source: CQG
The 10-minute chart illustrates the price sunk in the wake of the release of the latest inventory data and was approaching a test of the March low at $1.519, which is critical technical support. The July contract already fell below the support level.
Price Weakness Continues As July Rolls to August
Over the past week, July natural gas futures on NYMEX rolled to August.
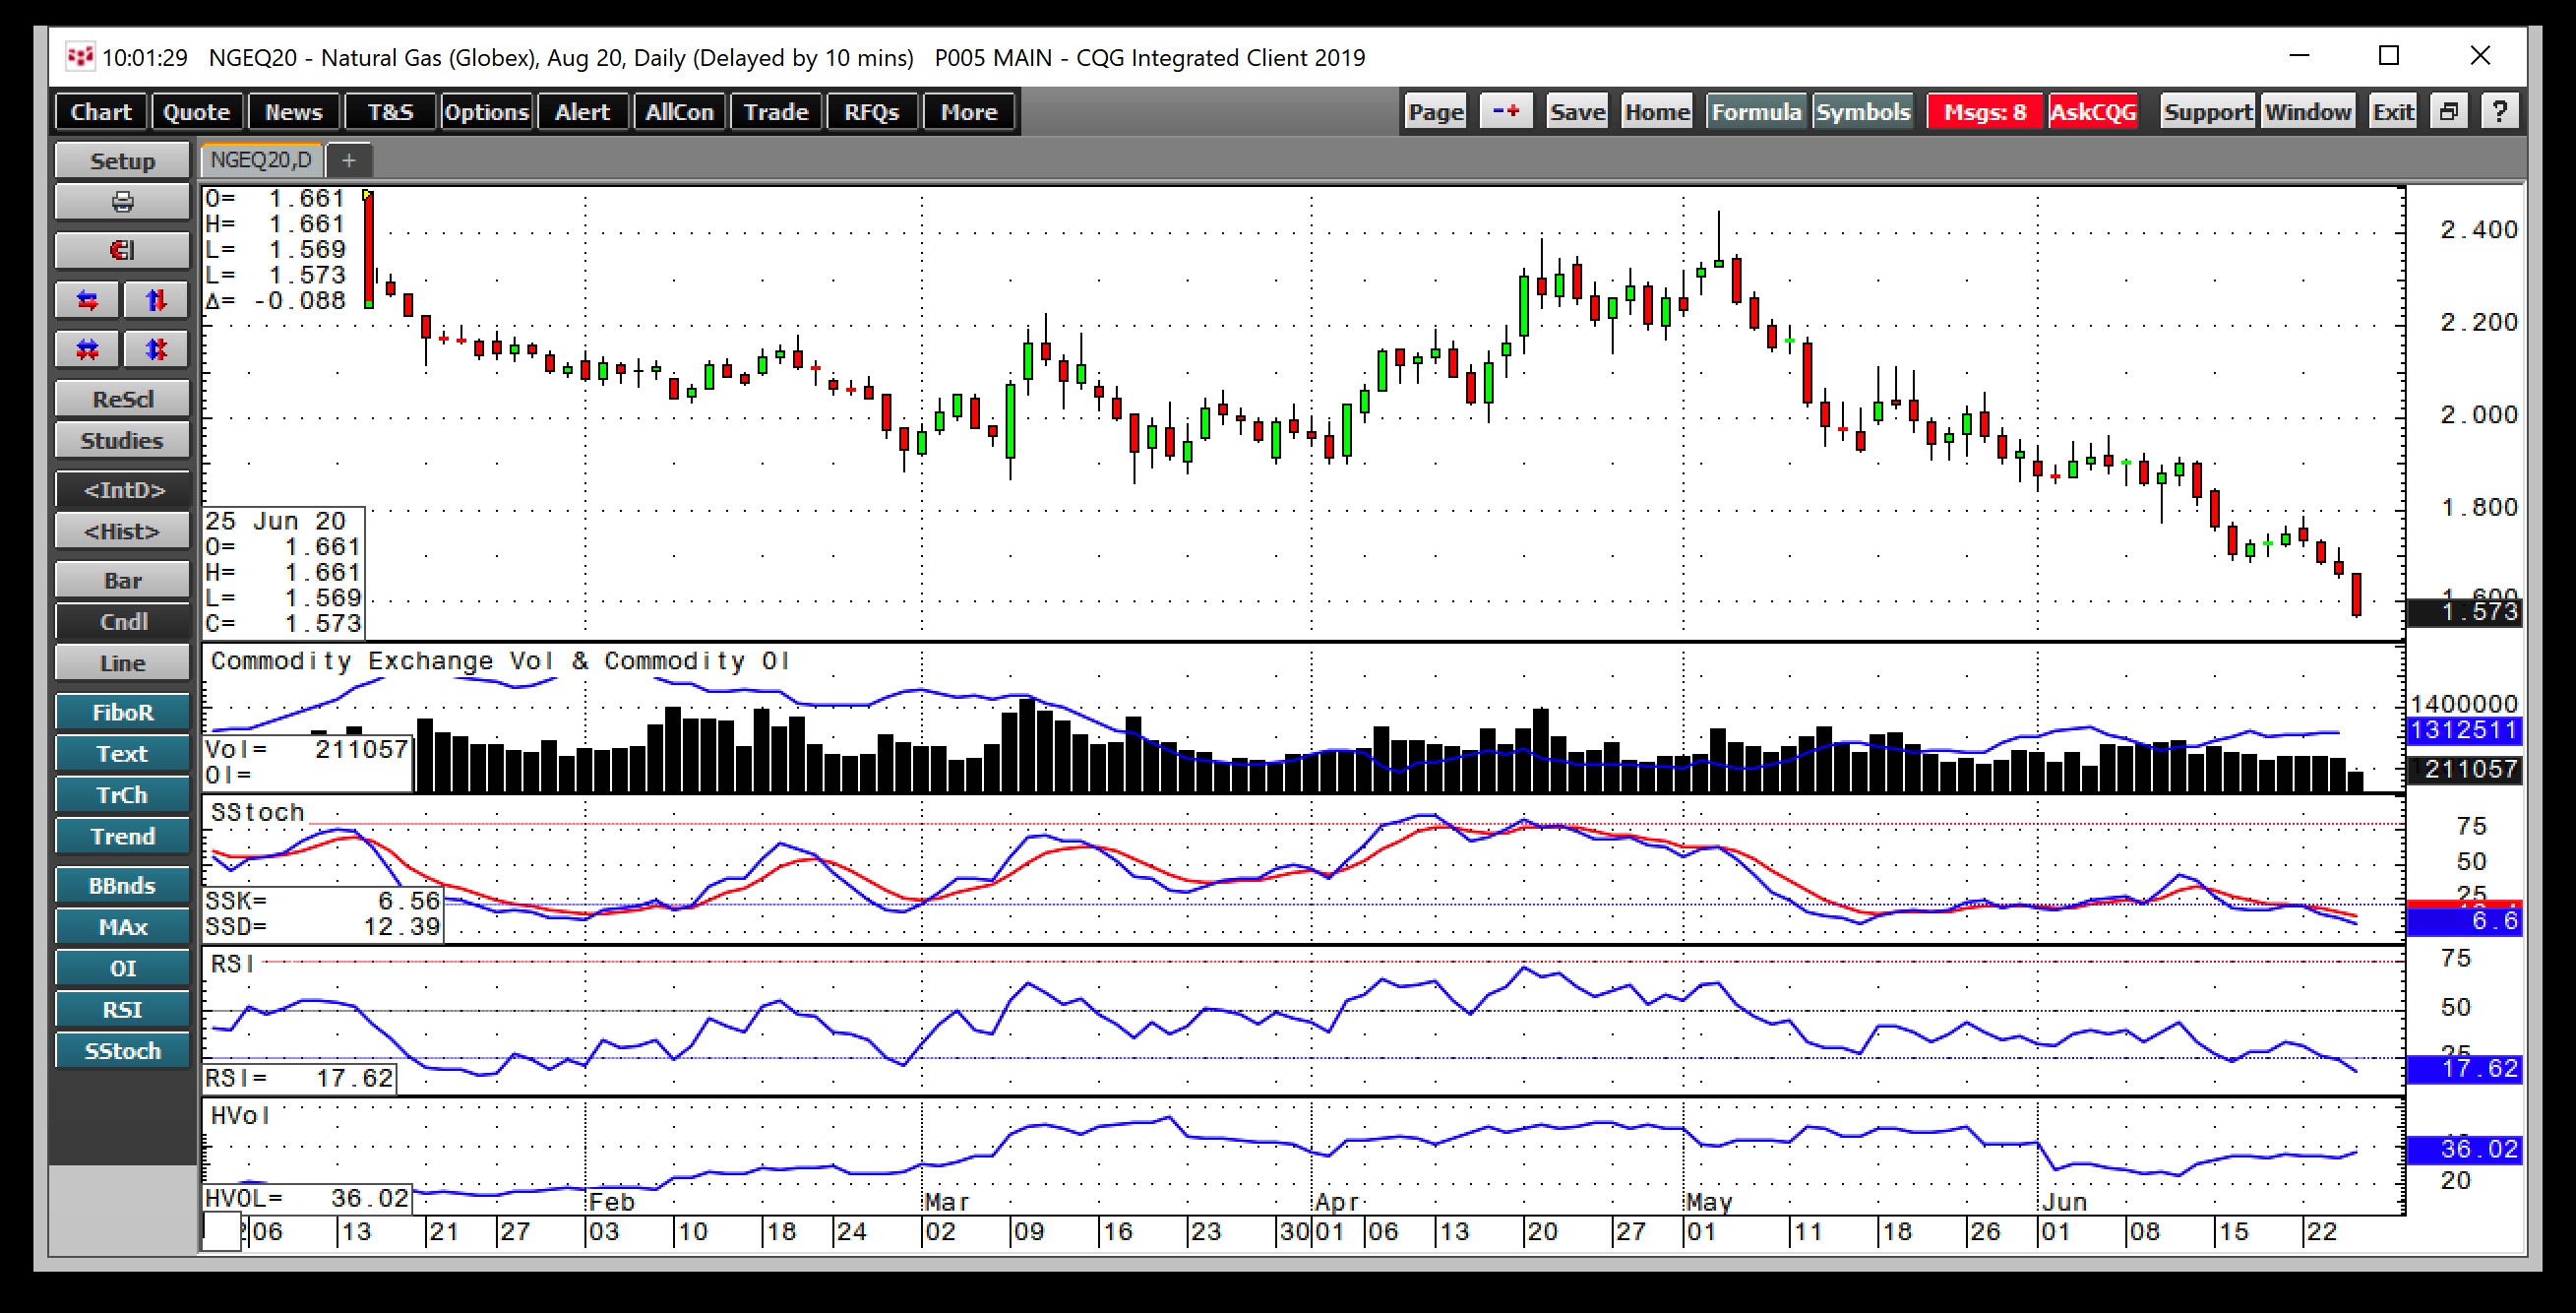
Source: CQG
The daily chart shows that below $1.60 per MMBtu, price momentum and relative strength indicators were sitting in oversold territory on June 25. Daily historical volatility at 35.7% has been steady since mid-June. The total number of open long and short positions in the natural gas futures markets has been edging higher to 1.3125 million contracts as of June 24. Rising open interest and falling prices tend to be a technical validation of a bearish price trend in a futures market.
Ugly Price Action, But Don’t Get Too Bearish
The August natural gas futures market looks awful at under $1.60 per MMBtu on June 25 and could be heading for a new low below the $1.50 per MMBtu level. Below there, the next technical level on the downside is at $1.335 and $1.25, levels not seen since 1995. The expiring July futures contract traded to a new quarter of a century low under $1.50 per MMBtu on June 25.
While natural gas looks ugly as the price continues to evaporate, keep three things in mind when considering a risk position. At 32.5% above last year’s level, natural gas stocks have moved to a lower percentage above last year’s level for the thirteenth consecutive week as of June 19. At the same time, the number of natural gas rigs operating in the US stood at 75 as of June 19, compared to 177 in mid-June 2019, according to Baker Hughes. Finally, the price range over the past three decades has been from $1.02 to $15.65 per MMBtu. At a new low below $1.50 on June 25, risk-reward favors the upside. However, I would only approach natural gas with a very tight stop in the current environment. If the market stops out the long position, I would look to re-enter at a lower level as it is impossible to pick a bottom in any market.